Control Panel
The Control Panel is a Next.js 16 web application that serves as the unified management and analytics interface for the entire AetherLake platform. It provides a cohesive, enterprise-grade design system across all screens with real-time Kubernetes telemetry, distributed query interfaces, stream orchestration, and Iceberg metadata exploration.
🏛️ Enterprise Design System & Core Features
Every view in the Control Panel adheres to a standardized corporate format:
- Standardized Header: Unified icon badge, title, subtitle badge, and real-time refresh action.
- 4-Card KPI Metric Grid: High-level operational metrics (health, active nodes, storage, throughput) displayed prominently above each view.
- Unified Filtering & Search: Instant, debounced search bars and category filters across all explorer trees and data grids.
- Bilingual Support (i18n): Fully internationalized in English (
en) and Turkish (tr) with runtime switching and zero layout shifts. - Enterprise Security: SSO integration with Keycloak OpenID Connect (OIDC), JWT role forwarding, and credentials-based fallback.
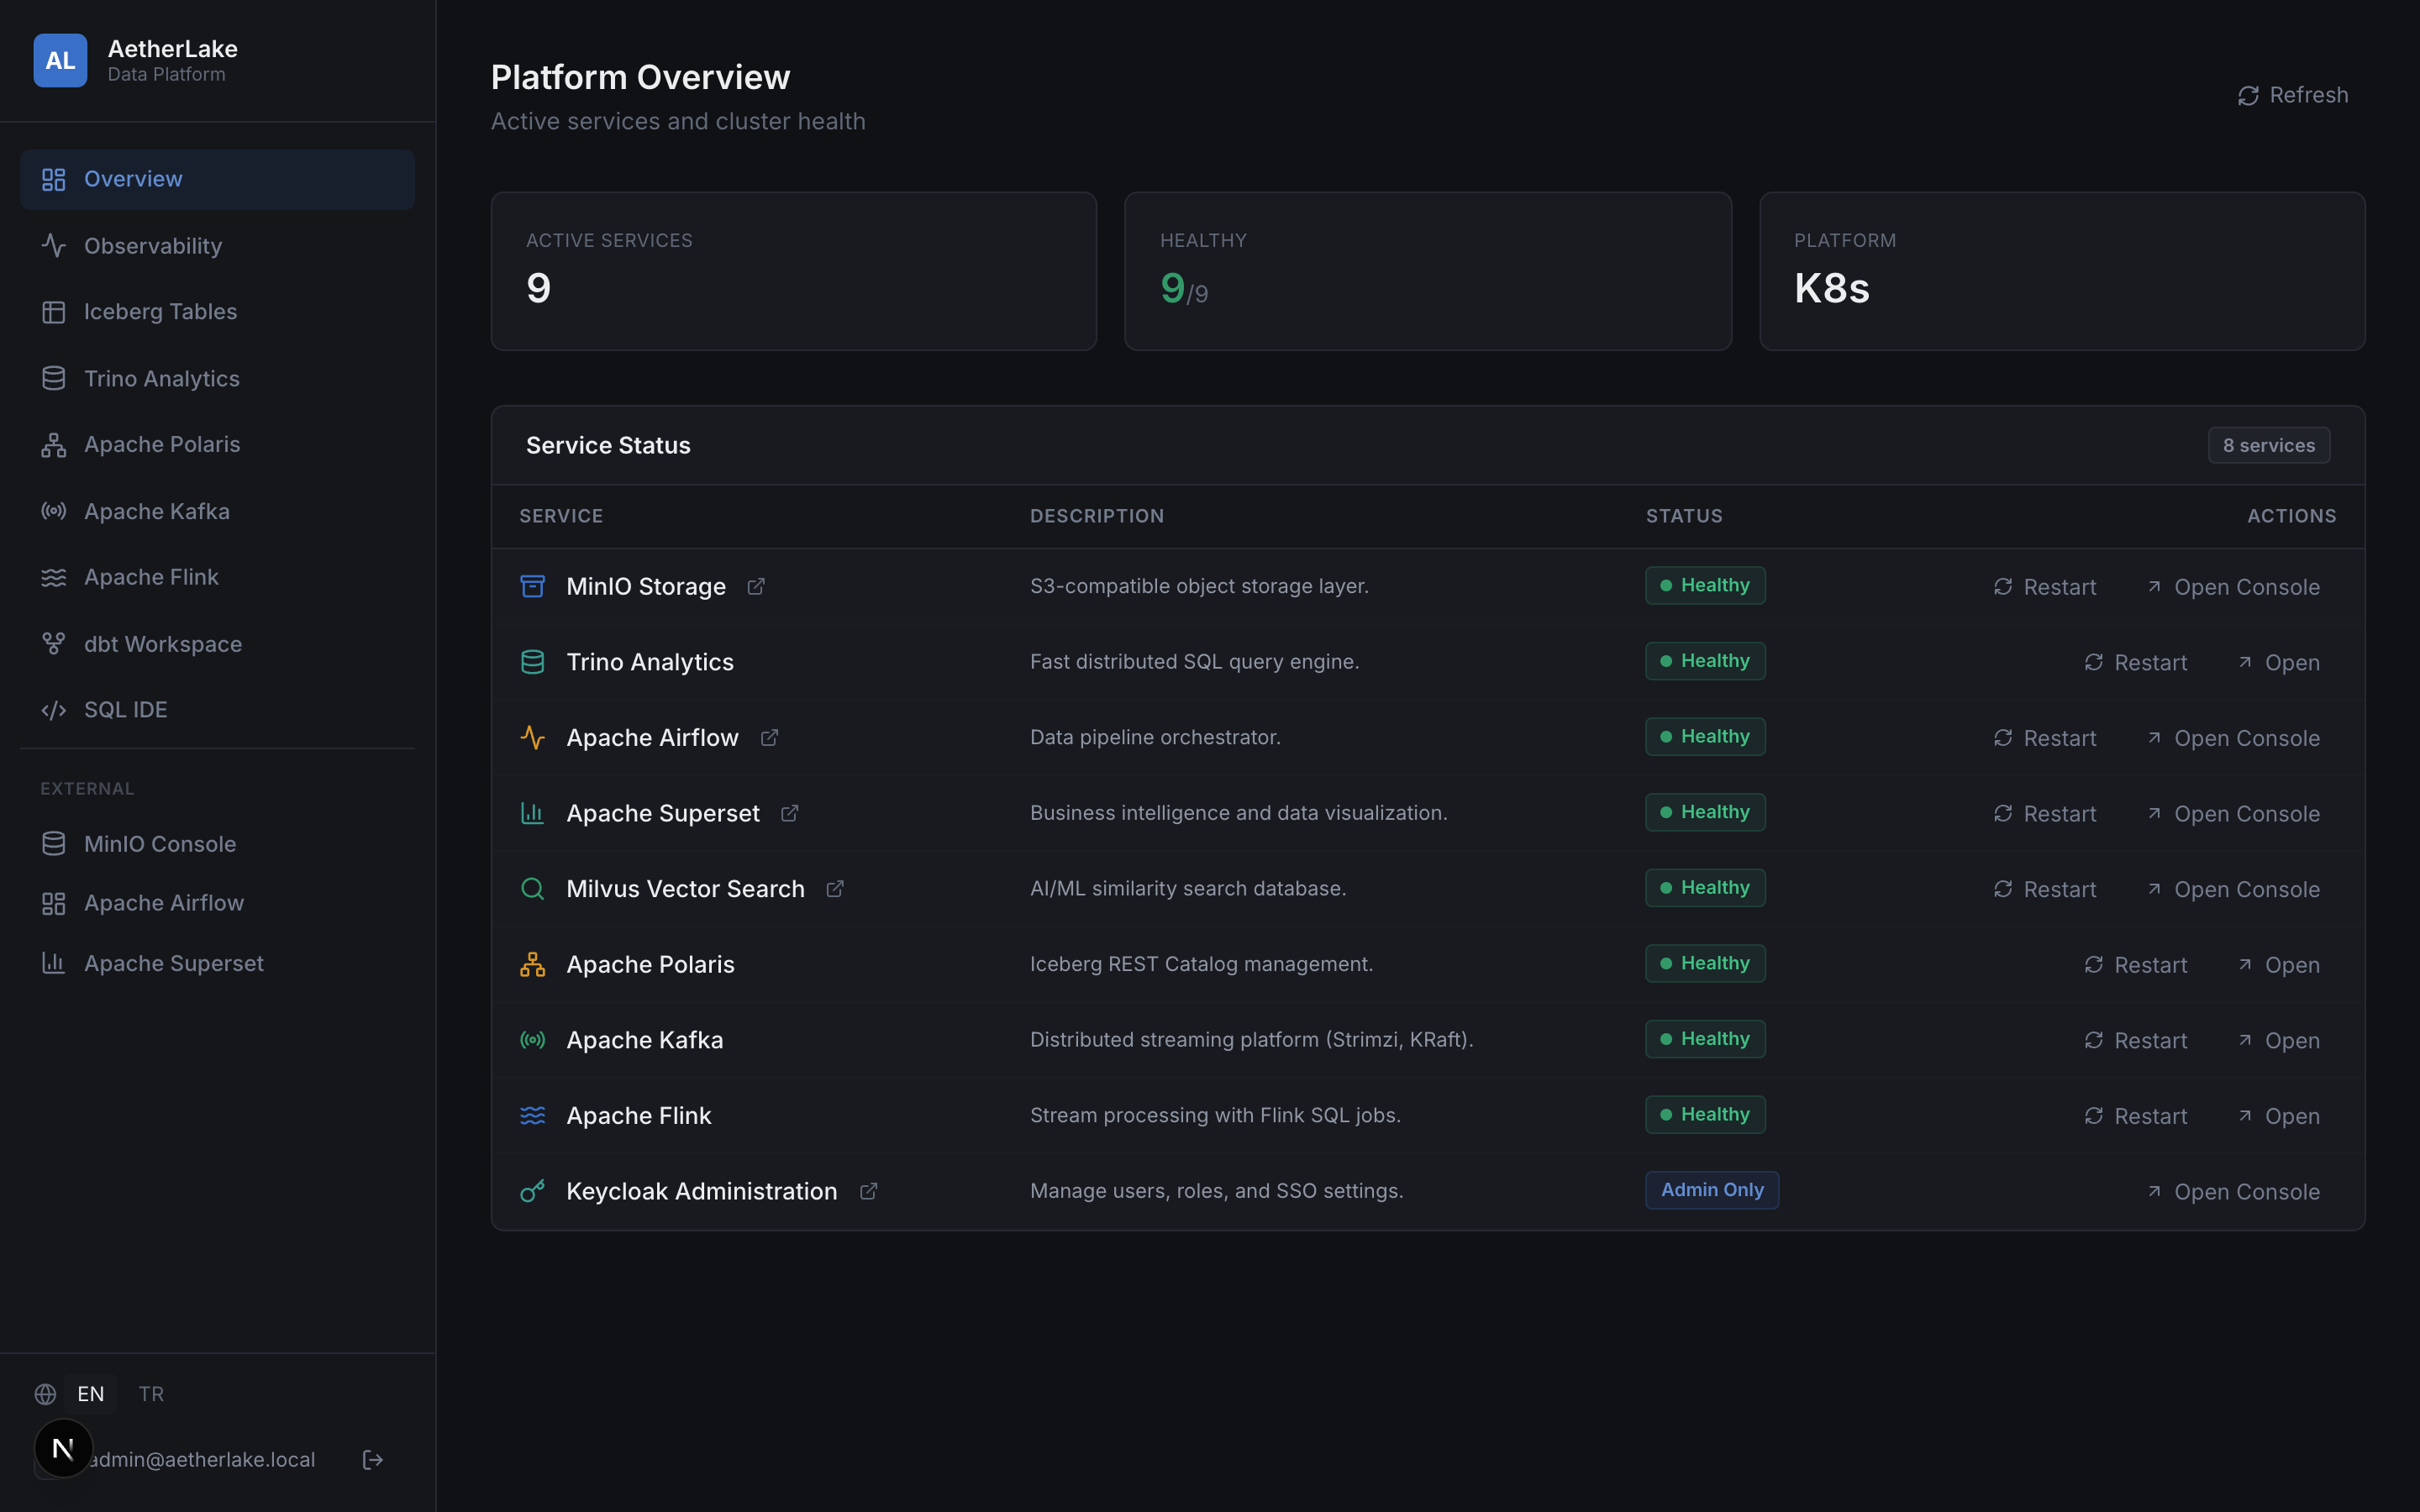
📊 Platform Overview (/)
The Platform Overview acts as the central mission control dashboard:
- Cluster KPI Metrics: Live summary cards showing Total Active Services, Overall Cluster Health %, Cloud/K8s Environment, and Telemetry connection status.
- Quick Launchpad: One-click action cards to jump straight to the SQL IDE, Iceberg Explorer, Flink Studio, dbt Lineage, or Observability.
- Category Filter Pills: Filter platform components instantly across
All,Lakehouse,Compute,Streaming, andOrchestration. - Instant Search: Search services by name, description, or internal/external endpoints.
- Service Controls: Trigger service restarts and view live pod phase indicators.
❄️ Iceberg Tables Explorer (/tables)
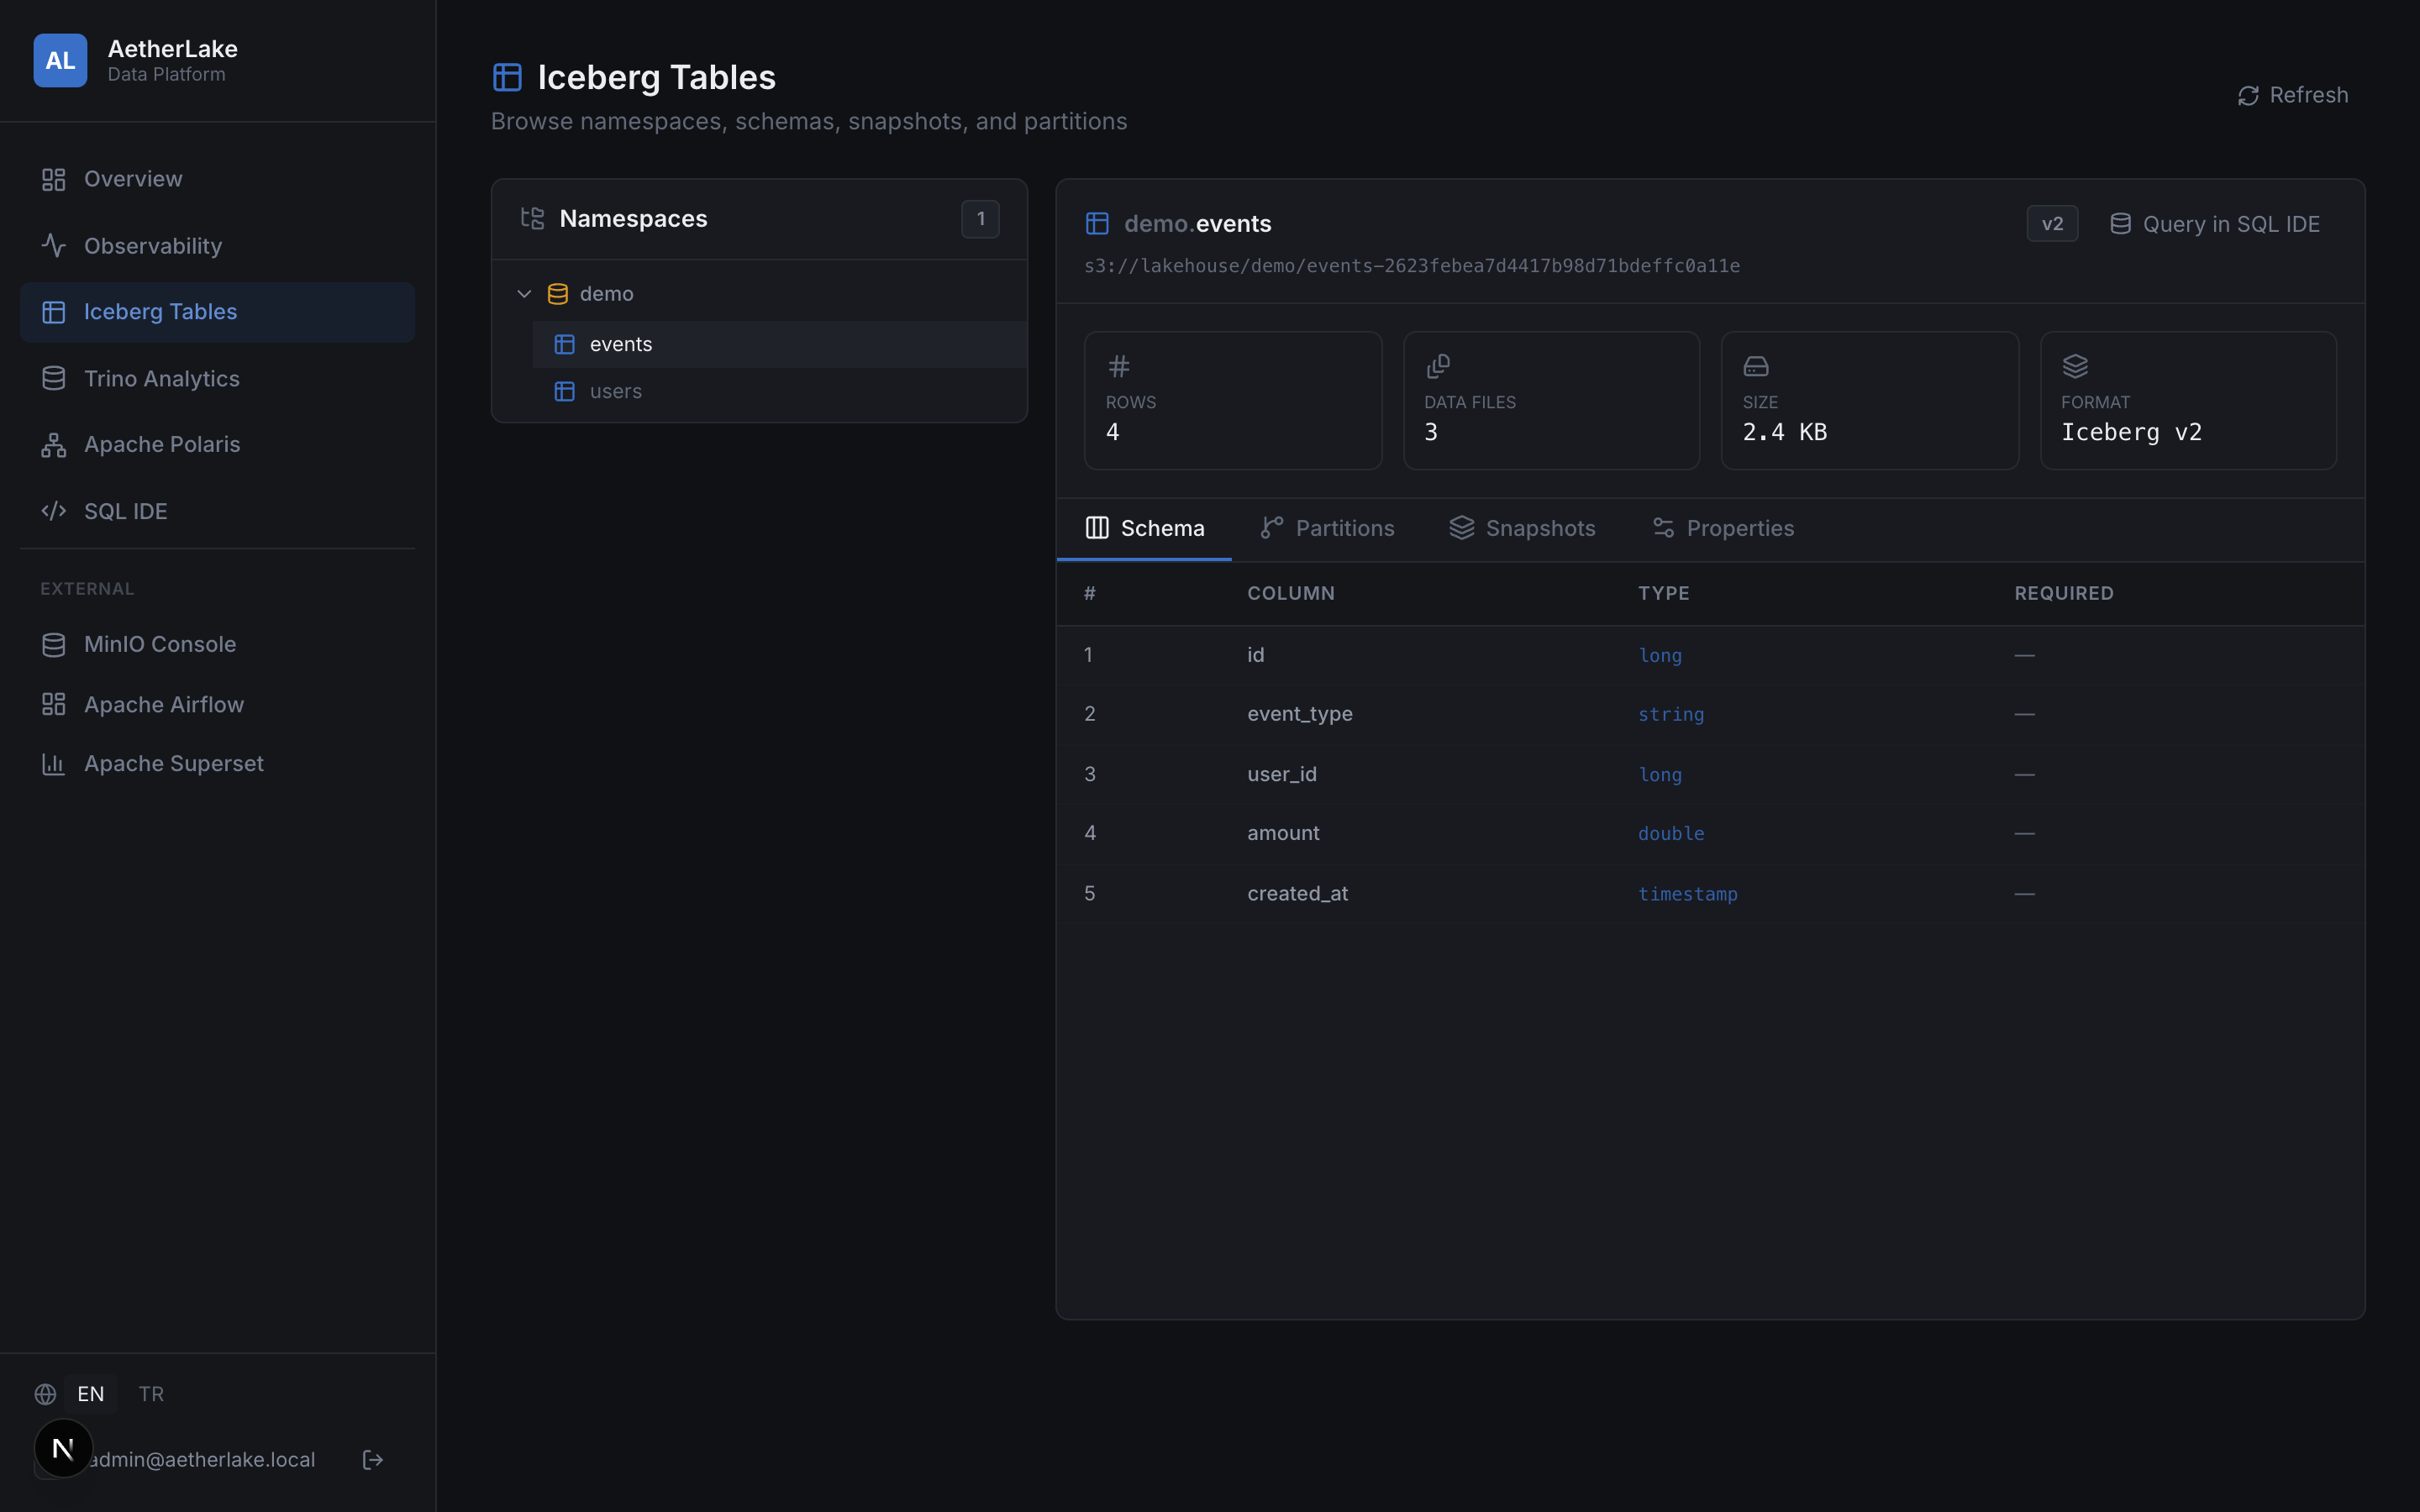
The Iceberg Tables page is a rich metadata and data inspection workbench connecting directly to the Apache Polaris Iceberg REST catalog:
- Namespace & Table Search: Search bar in the catalog sidebar to instantly filter through namespaces and tables.
- One-Click Clipboard Actions: Copy Table Reference (
iceberg.<ns>.<table>) and S3 Storage Location directly to clipboard. - 4-Card Metric Grid: Real-time snapshot statistics displaying Total Rows, Total Data Files, Total Table Size (formatted in bytes/MB/GB), Format Version, and Schema Column count.
- 5-Tab Deep Inspector:
- Overview: Snapshot summary, file format, and table location.
- Schema: Full column-level schema definitions with Iceberg types and nullability constraints.
- Partitions: Partition specifications, transforms (e.g.
identity,bucket,hour), and source columns. - Snapshots: Complete table commit history, operation types (
append,overwrite), timestamp, and added rows. - Data Preview: Live data querying executing
SELECT * FROM iceberg.<ns>.<table> LIMIT 20via Trino. Renders an interactive, scrollable data table with column type indicators, row counters, and error fallbacks.
Demo dataset
A fresh install seeds a small demo dataset — iceberg.demo.events (partitioned by event_type) and iceberg.demo.users — via a post-install hook, so this page and the SQL IDE have data immediately out of the box.
⚡ SQL IDE (/query)
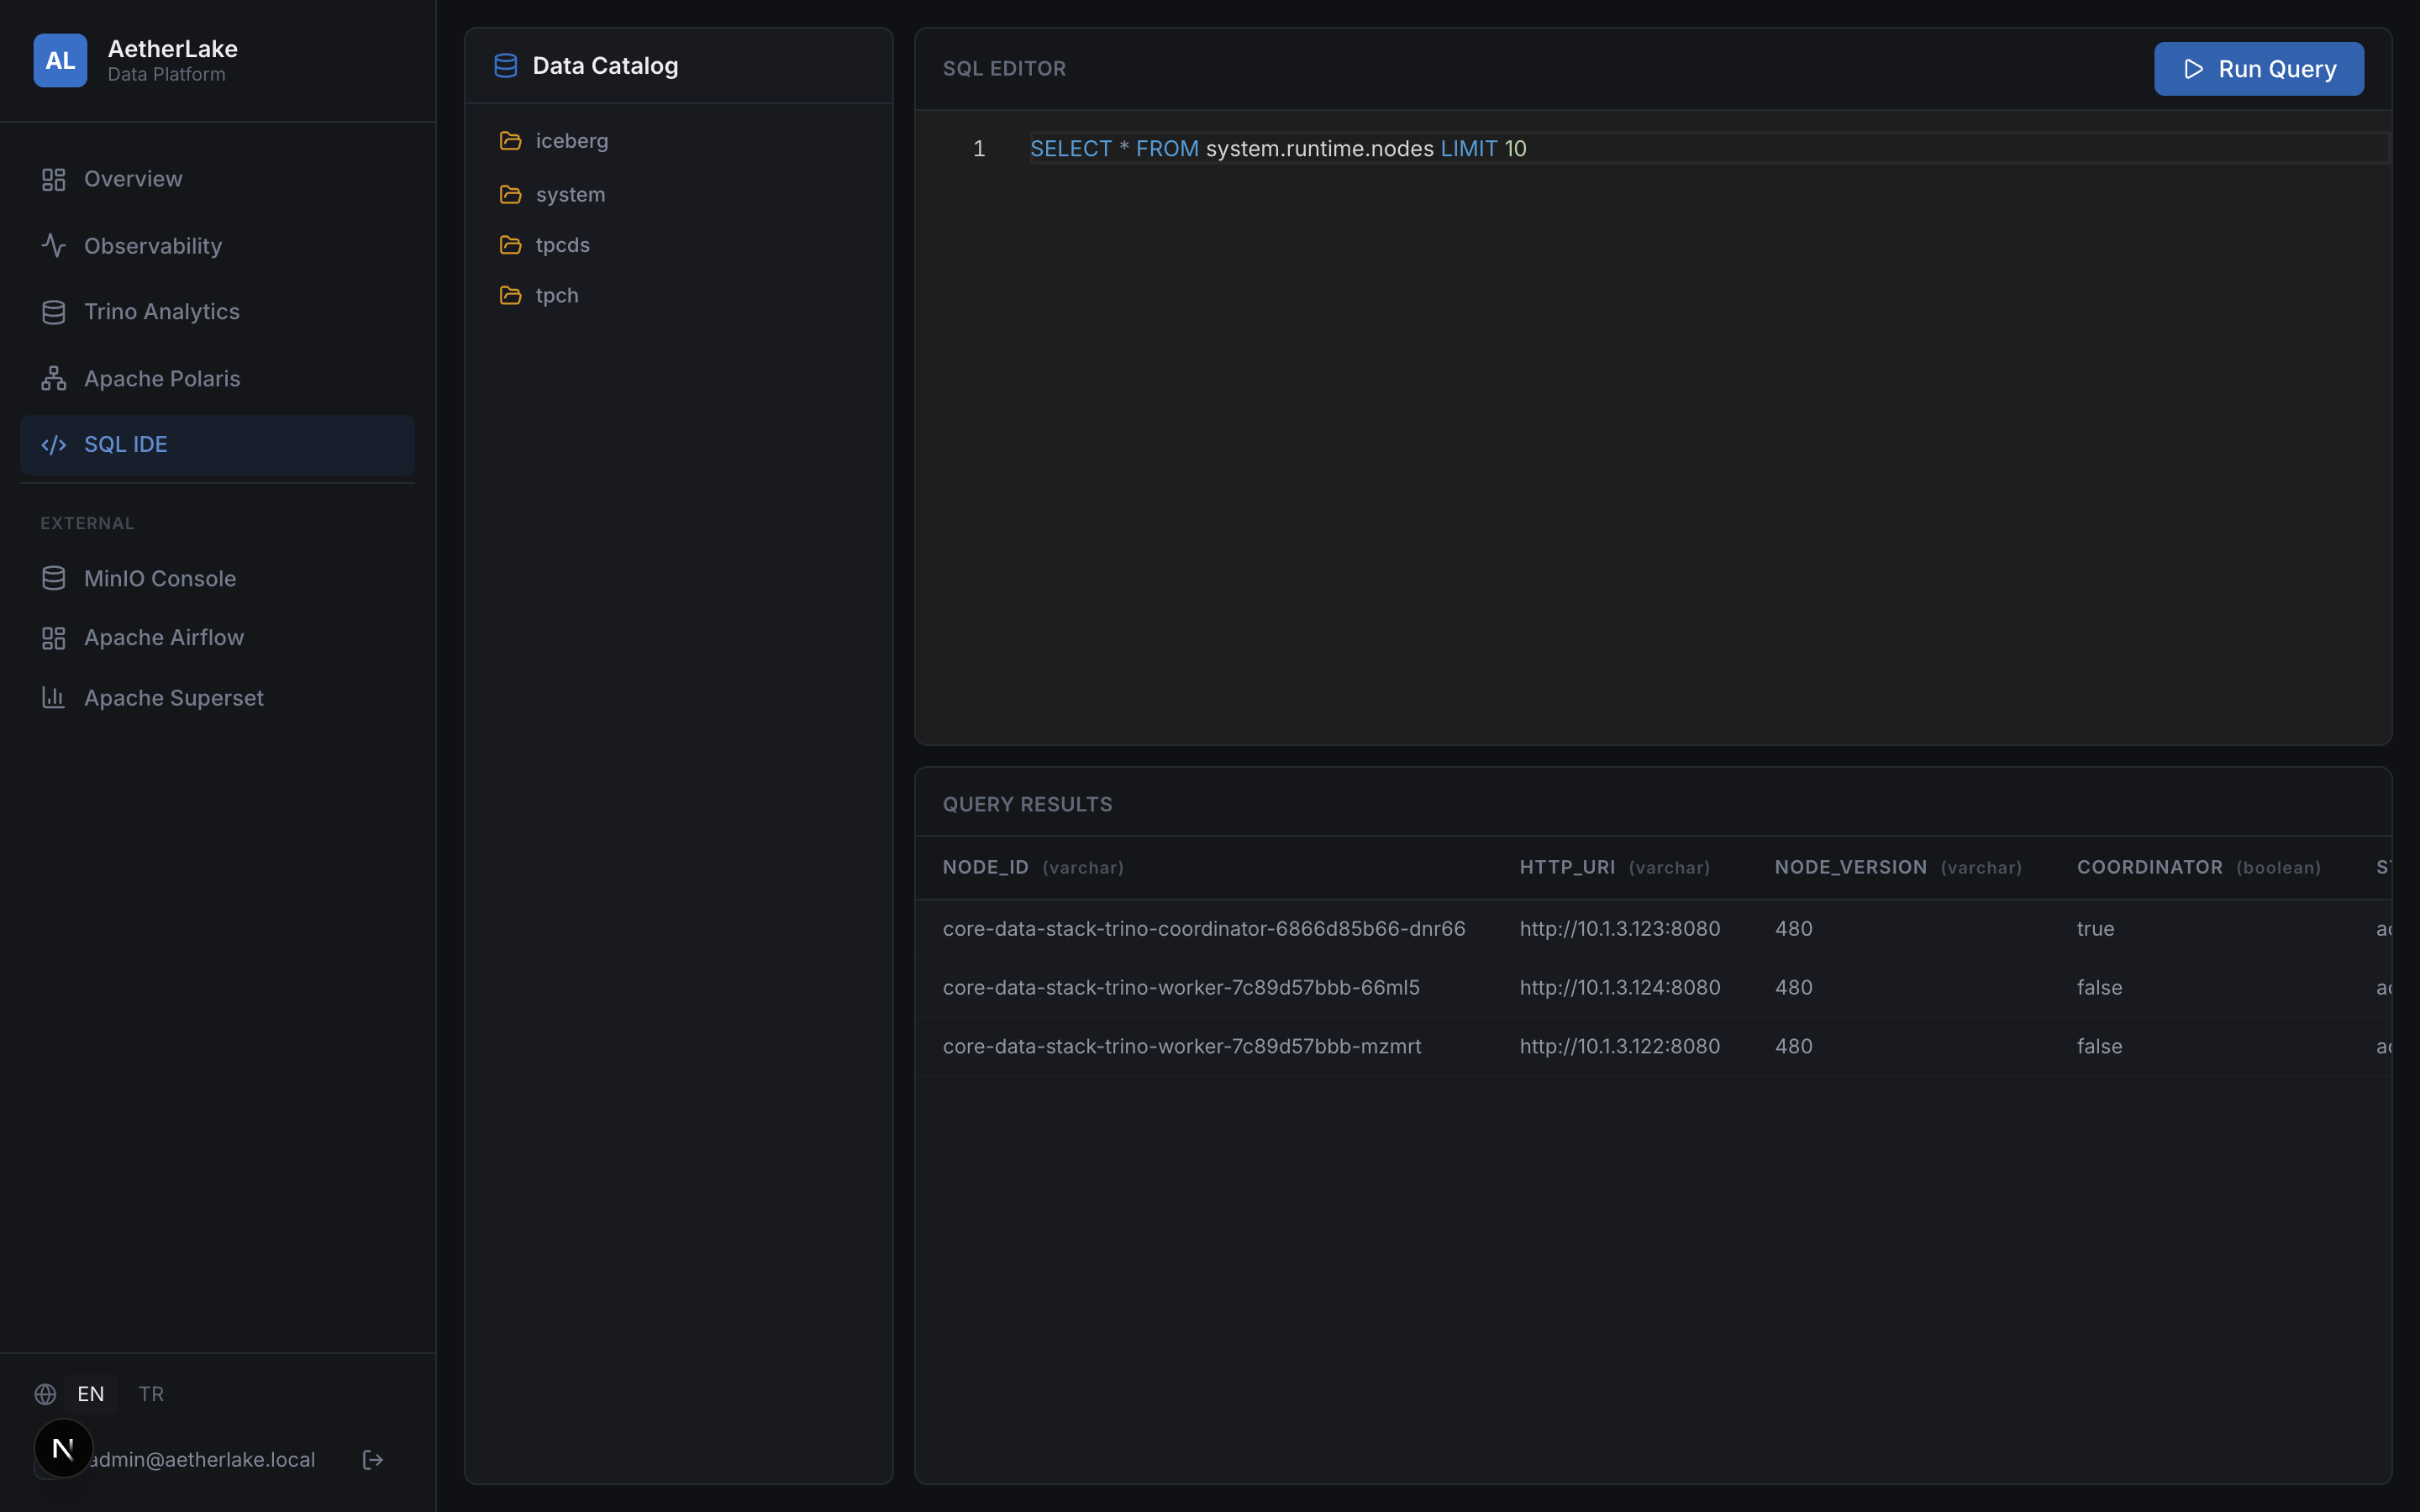
The SQL IDE provides a browser-based Monaco SQL editor integrated with Trino's distributed query engine:
- Role-Based Execution: For Keycloak logins, the panel forwards your access token and Trino executes queries under your username. Role-based access control (RBAC) is enforced server-side.
- Schema & Table Search: Real-time filter input in the data catalog explorer to instantly search through catalogs, schemas, and tables.
- Quick SQL Snippet Pills: One-click insert pills for common queries (
SHOW CATALOGS,SHOW SCHEMAS,SHOW TABLES,LIMIT 50). - Execution Performance Stopwatch: Measures exact query execution duration in milliseconds (e.g.
85 ms) alongside row and column metrics. - Persistent Query History: Slide-over drawer persisting past executed queries in
localStoragewith execution status, query duration, timestamps, and one-click re-run capability. - Data Export:
- Export CSV: Download query result sets directly as
.csvfiles. - Copy JSON: Copy formatted JSON records directly to clipboard for API testing.
- Export CSV: Download query result sets directly as
📡 Apache Kafka Management (/kafka)
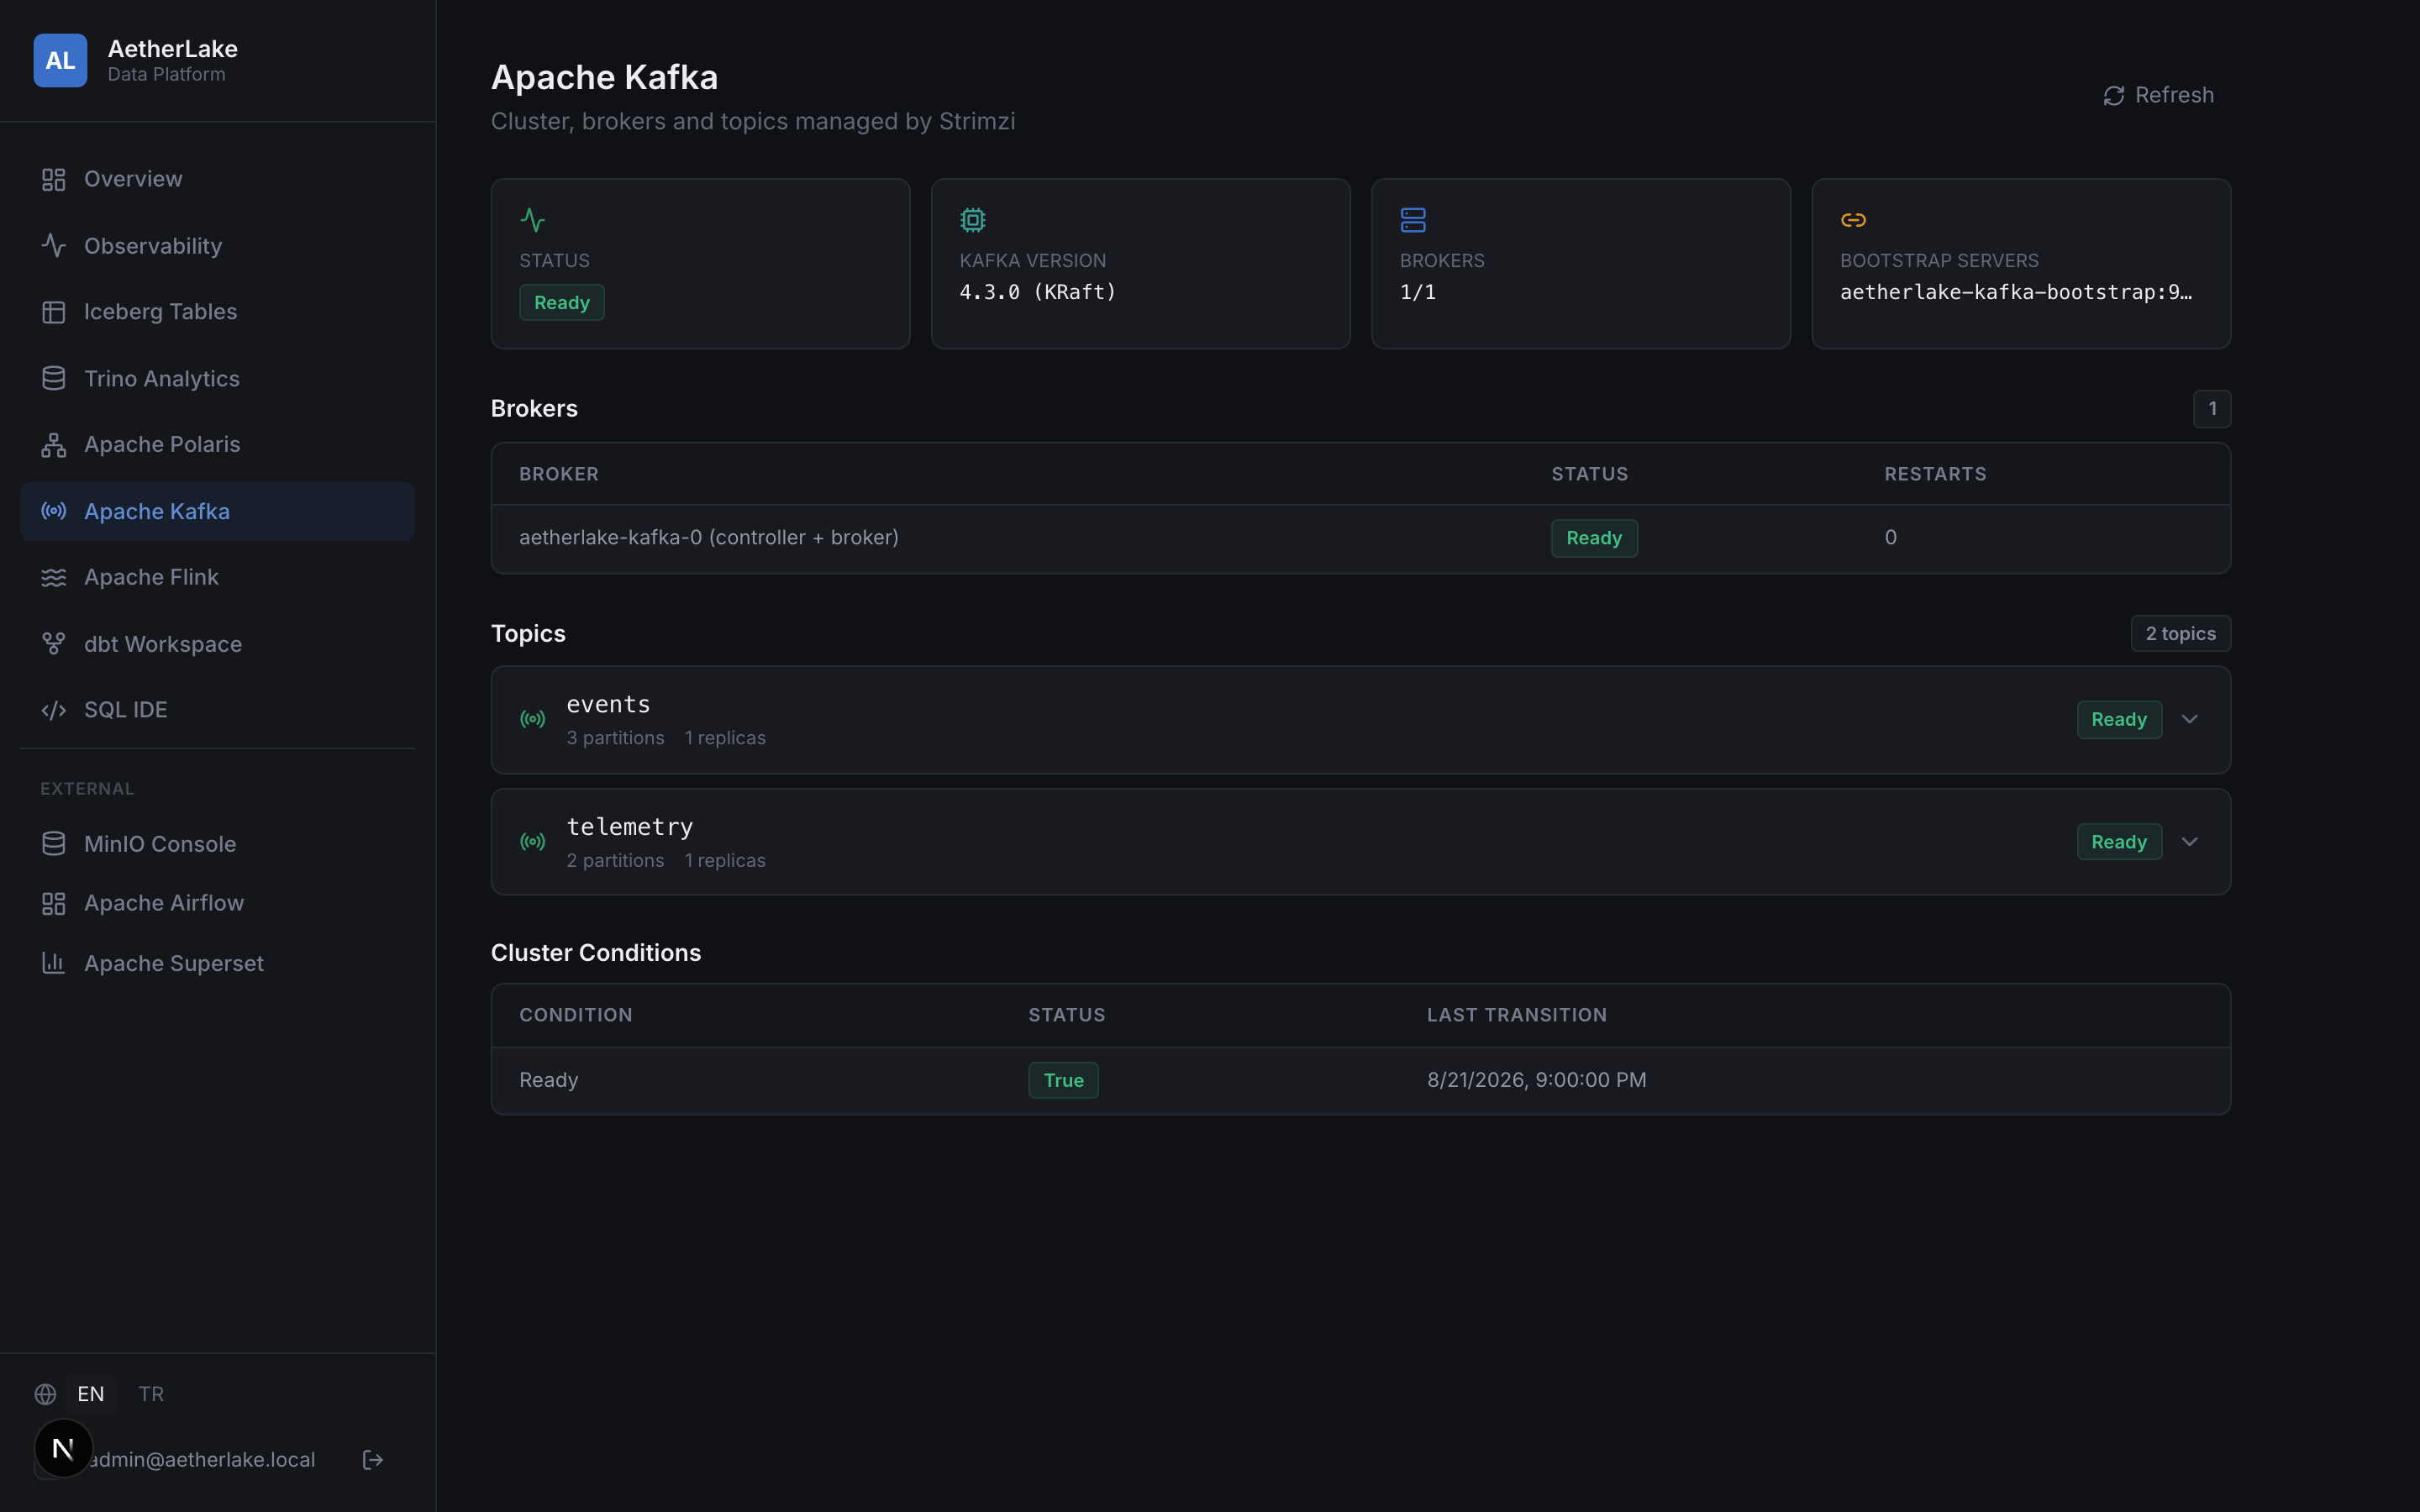
The Kafka page (/kafka) introspects Strimzi custom resources to manage event streams:
- Cluster KPI Grid: 4-card overview displaying Cluster Status (
Ready), Total Topic count, Total Partitions (calculated across all topics), and Online Broker ratio. - Listeners & Endpoints Banner: Displays internal plaintext (
aetherlake-kafka-bootstrap:9092) and external endpoints with one-click copy buttons. - Topic Search Filter: Instant topic search filter bar.
- Deep-Link Shortcuts per Topic:
- Query in SQL IDE: One-click shortcut that opens the SQL IDE pre-populated with
SELECT * FROM kafka."default"."<topic>" LIMIT 50;. - Stream in Flink: One-click shortcut that opens Flink Studio pre-populated with streaming table DDL and query for that topic.
- Query in SQL IDE: One-click shortcut that opens the SQL IDE pre-populated with
- Topic Inspector: Detailed table partition counts, replica counts, Strimzi reconciliation conditions, and topic configuration overrides.
🌊 Apache Flink Streaming Studio (/flink)
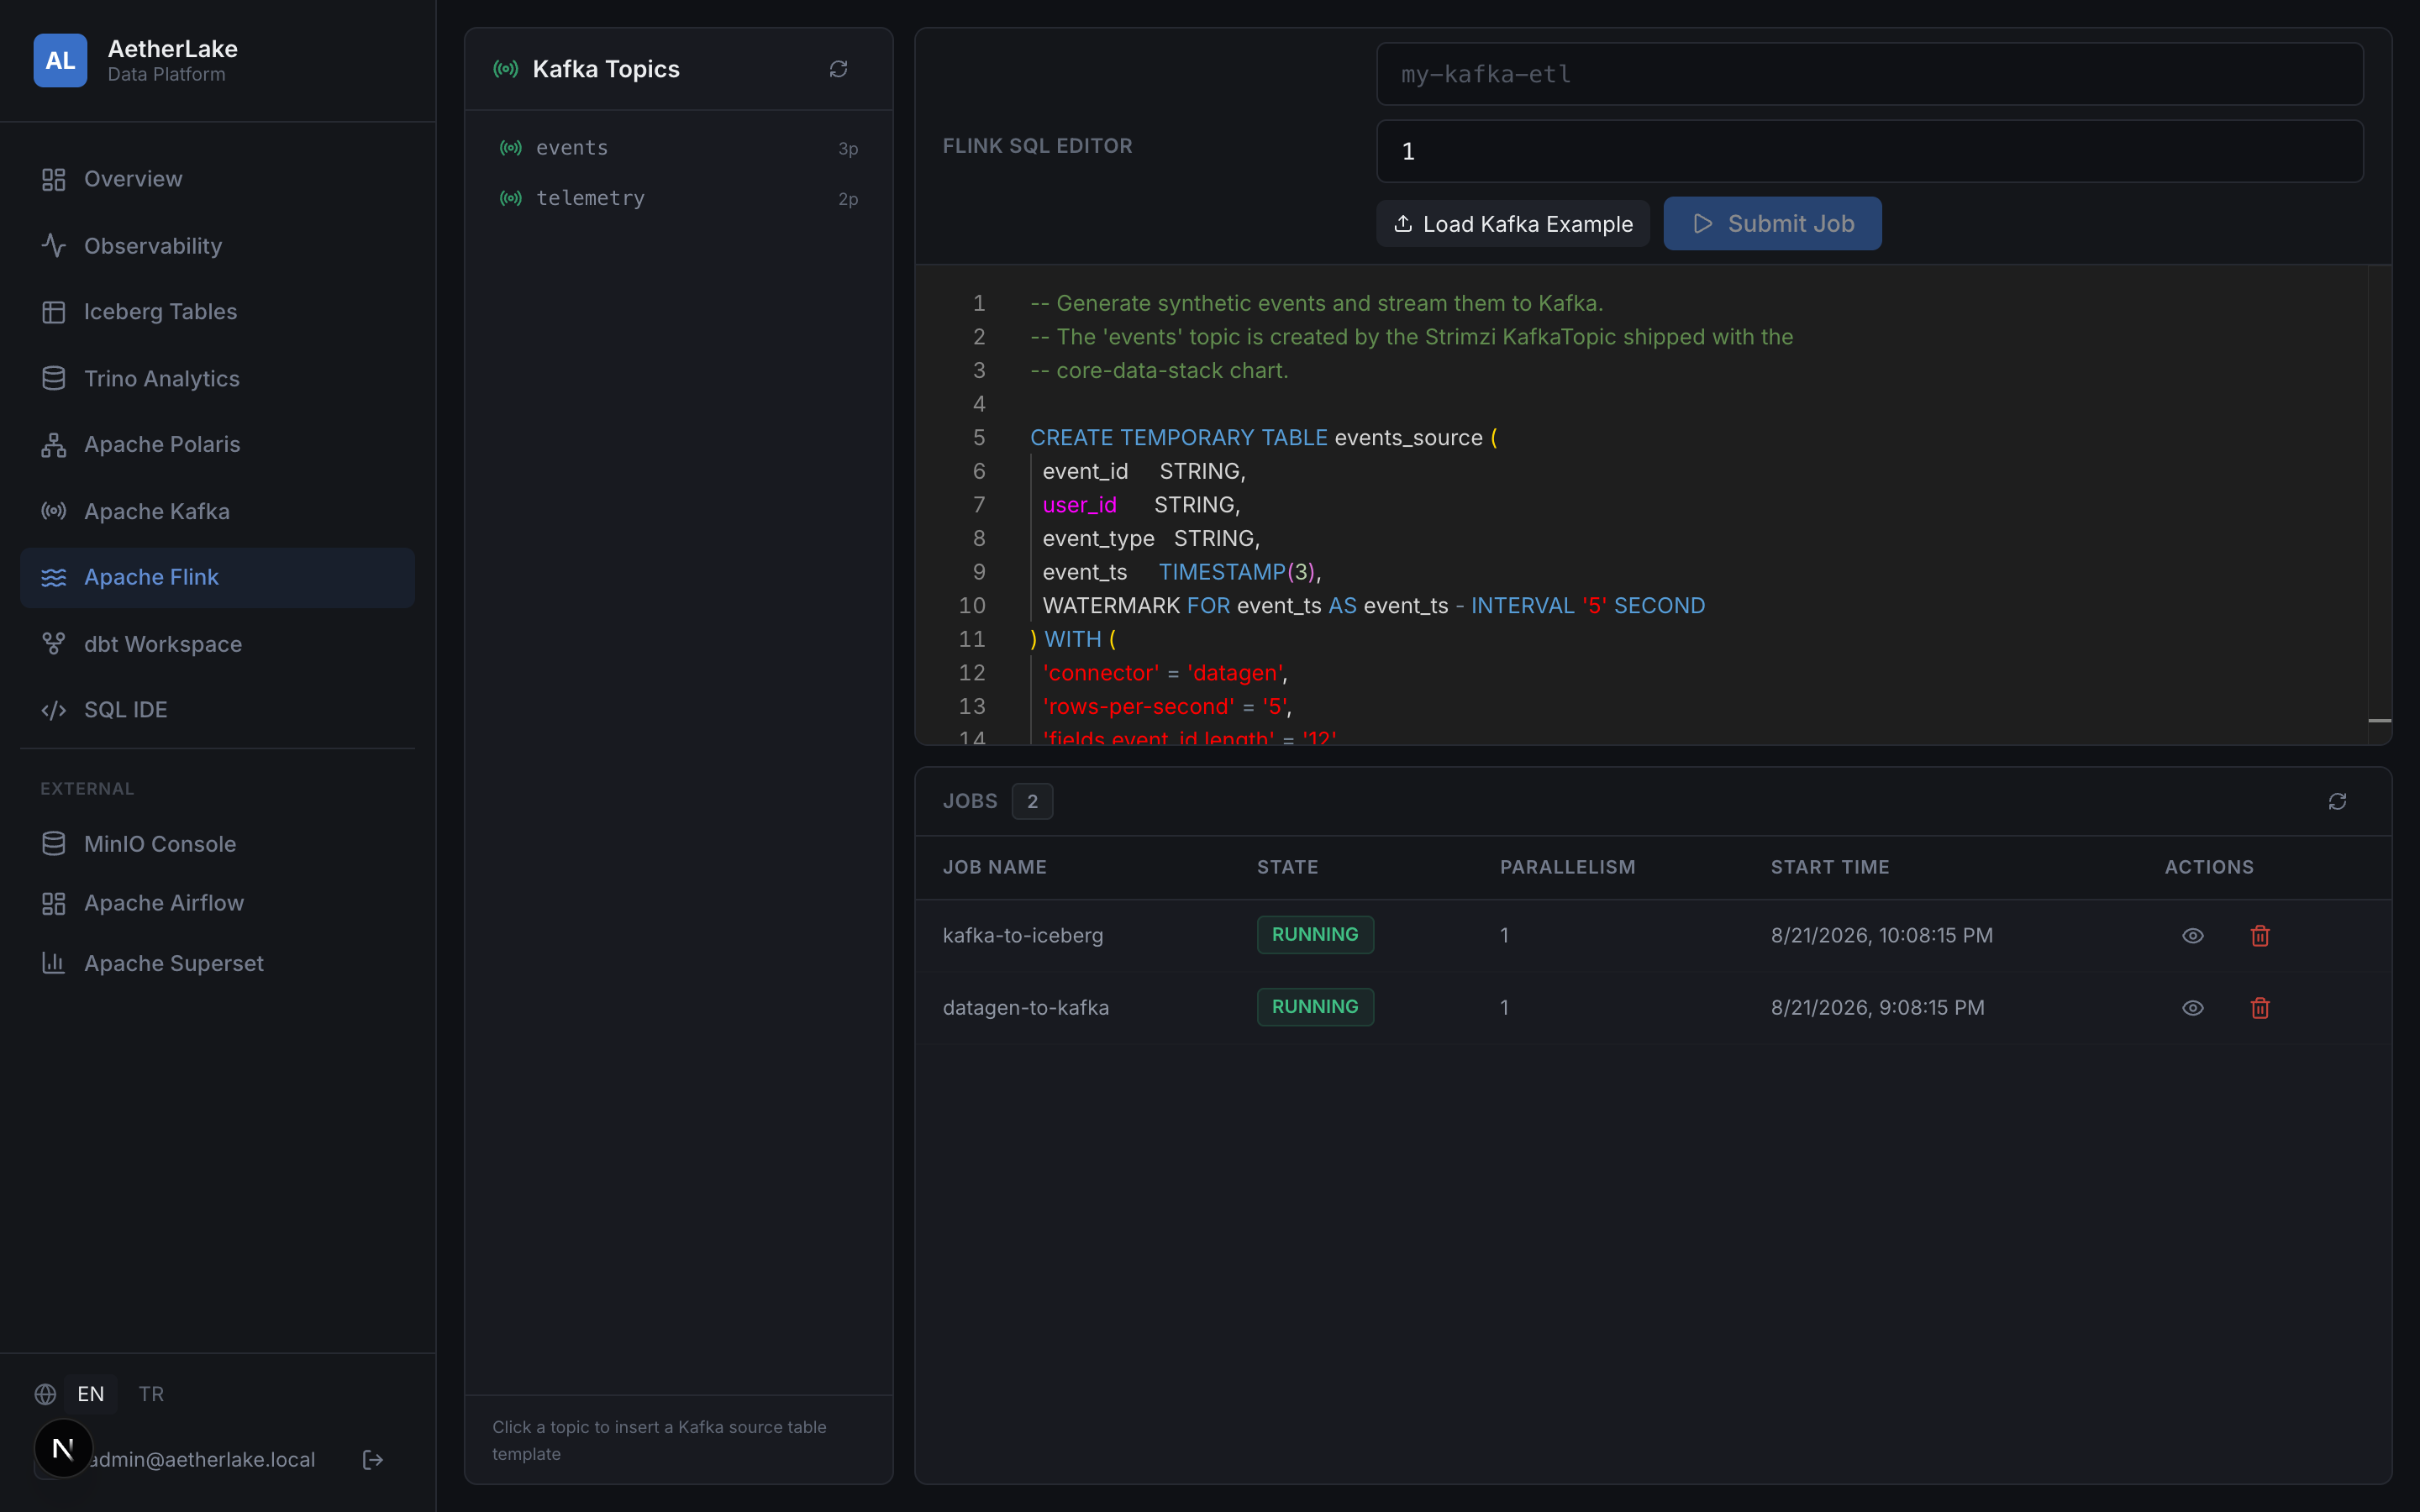
The Flink page (/flink) provides a full stream processing workspace backed by the Flink Kubernetes Operator:
- Stream Studio KPI Grid: Total Jobs, Running Jobs (with live status dot), Failed/Suspended Jobs, and Operator Mode (
Flink K8s Operator v1.10 · HA Native). - Streaming SQL Template Selector: Pre-packaged enterprise streaming templates ready to run:
- Datagen → Kafka: Synthetic event stream generator for pipeline testing.
- Kafka → Iceberg Bridge: Real-time event ingestion streaming directly into Apache Iceberg lakehouse tables.
- Tumbling Window Aggregation: 1-minute event-time tumbling window aggregation computing counts and revenue metrics.
- Stream Filter & Routing: Low-latency threshold filtering routing alerts to secondary Kafka topics.
- Kafka Topic Explorer Sidebar: Searchable list of Kafka topics with partition counts. Clicking a topic appends a ready-to-run streaming table DDL into the editor.
- State Filter Tabs: Instant filtering of submitted jobs across
All,RUNNING,SUSPENDED, andFAILED. - Job Lifecycle Management: Track parallelism, start time, execution errors, view submitted SQL statements in a modal, or cancel running jobs.
🌐 Apache Polaris Management (/polaris)
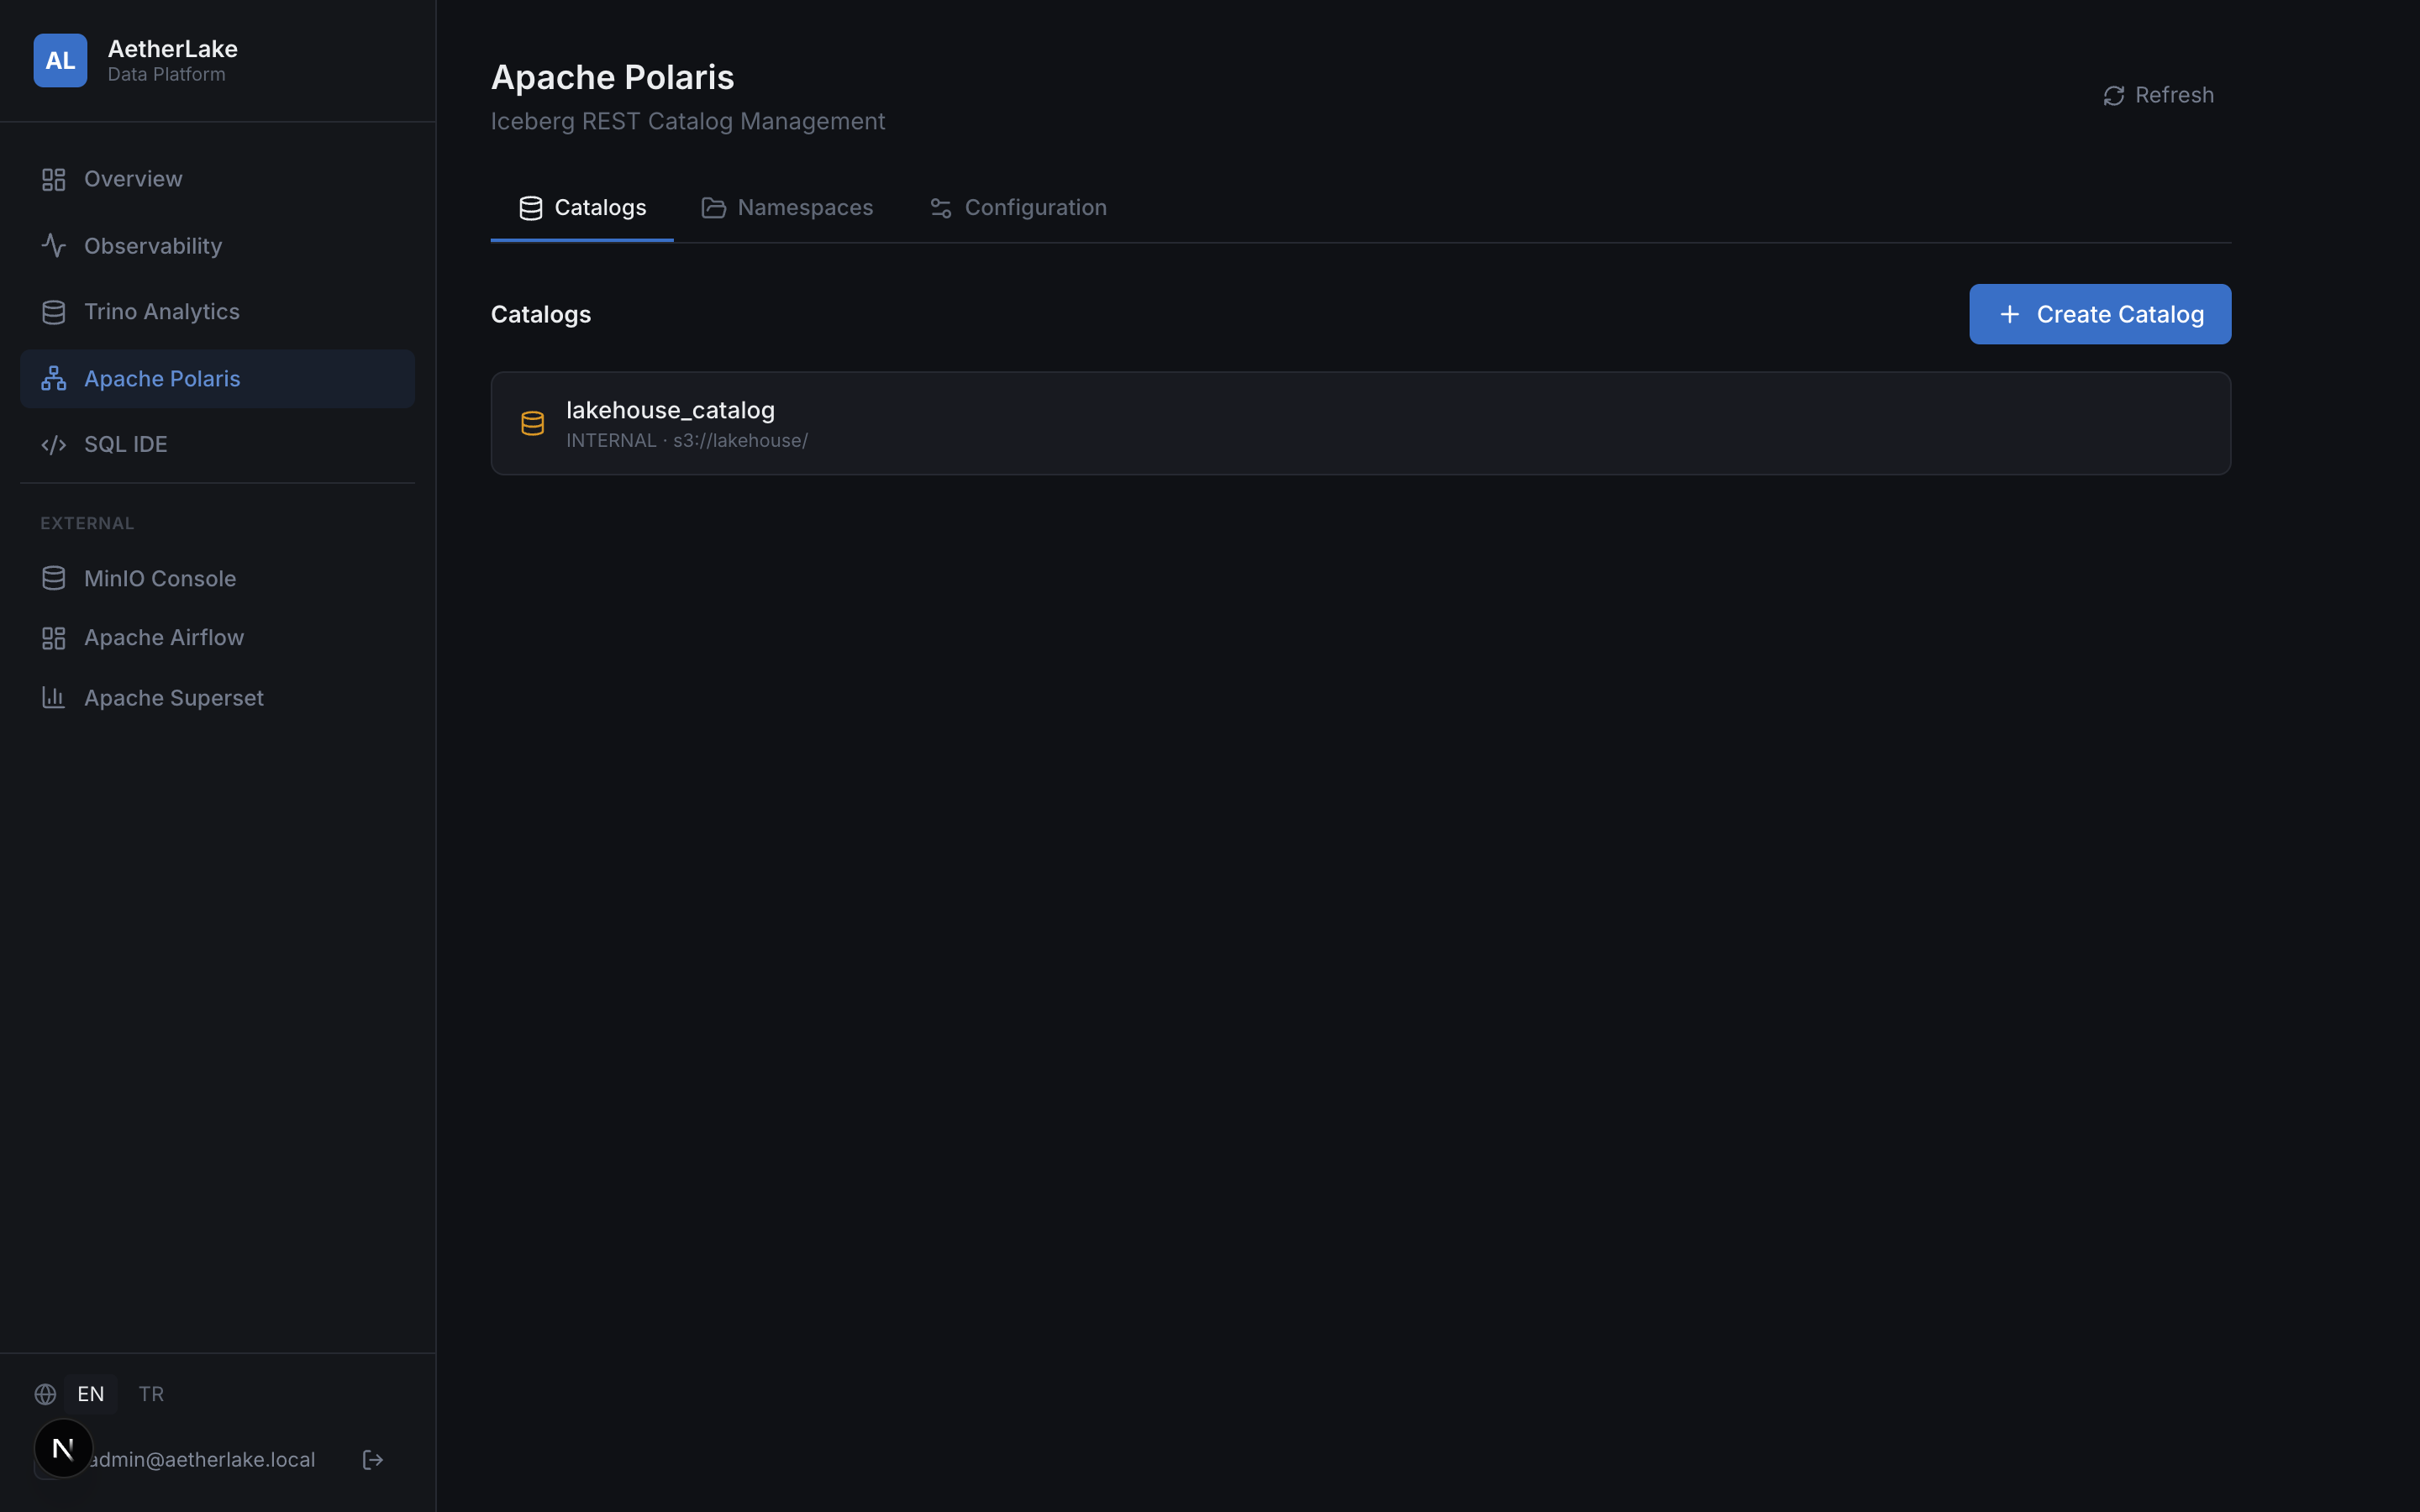
The Polaris Management page provides governance over the Apache Polaris REST Catalog:
- Polaris KPI Grid: Configured Catalogs, Namespaces in Selected Catalog, Catalog REST URI, and Credential Vending status (
OAuth2 · RBAC Vended). - Catalog & Namespace Search: Instant search filtering catalogs and namespaces.
- Explore in Tables: Direct shortcut link on each namespace to explore its tables in
/tables. - Client Integration Snippets Tab: Copy-paste integration snippets with one-click copy buttons for:
- Trino:
etc/catalog/iceberg.propertiesREST catalog configuration. - Apache Spark: PySpark
SparkSessionbuilder configuration for Polaris REST Catalog and S3FileIO. - PyIceberg: Python client initialization using
pyiceberg.catalog.load_catalog.
- Trino:
- Catalog & Namespace Creation: Create internal REST catalogs with custom S3 warehouse paths and namespaces without CLI tools.
⚡ Trino Analytics Management (/trino)
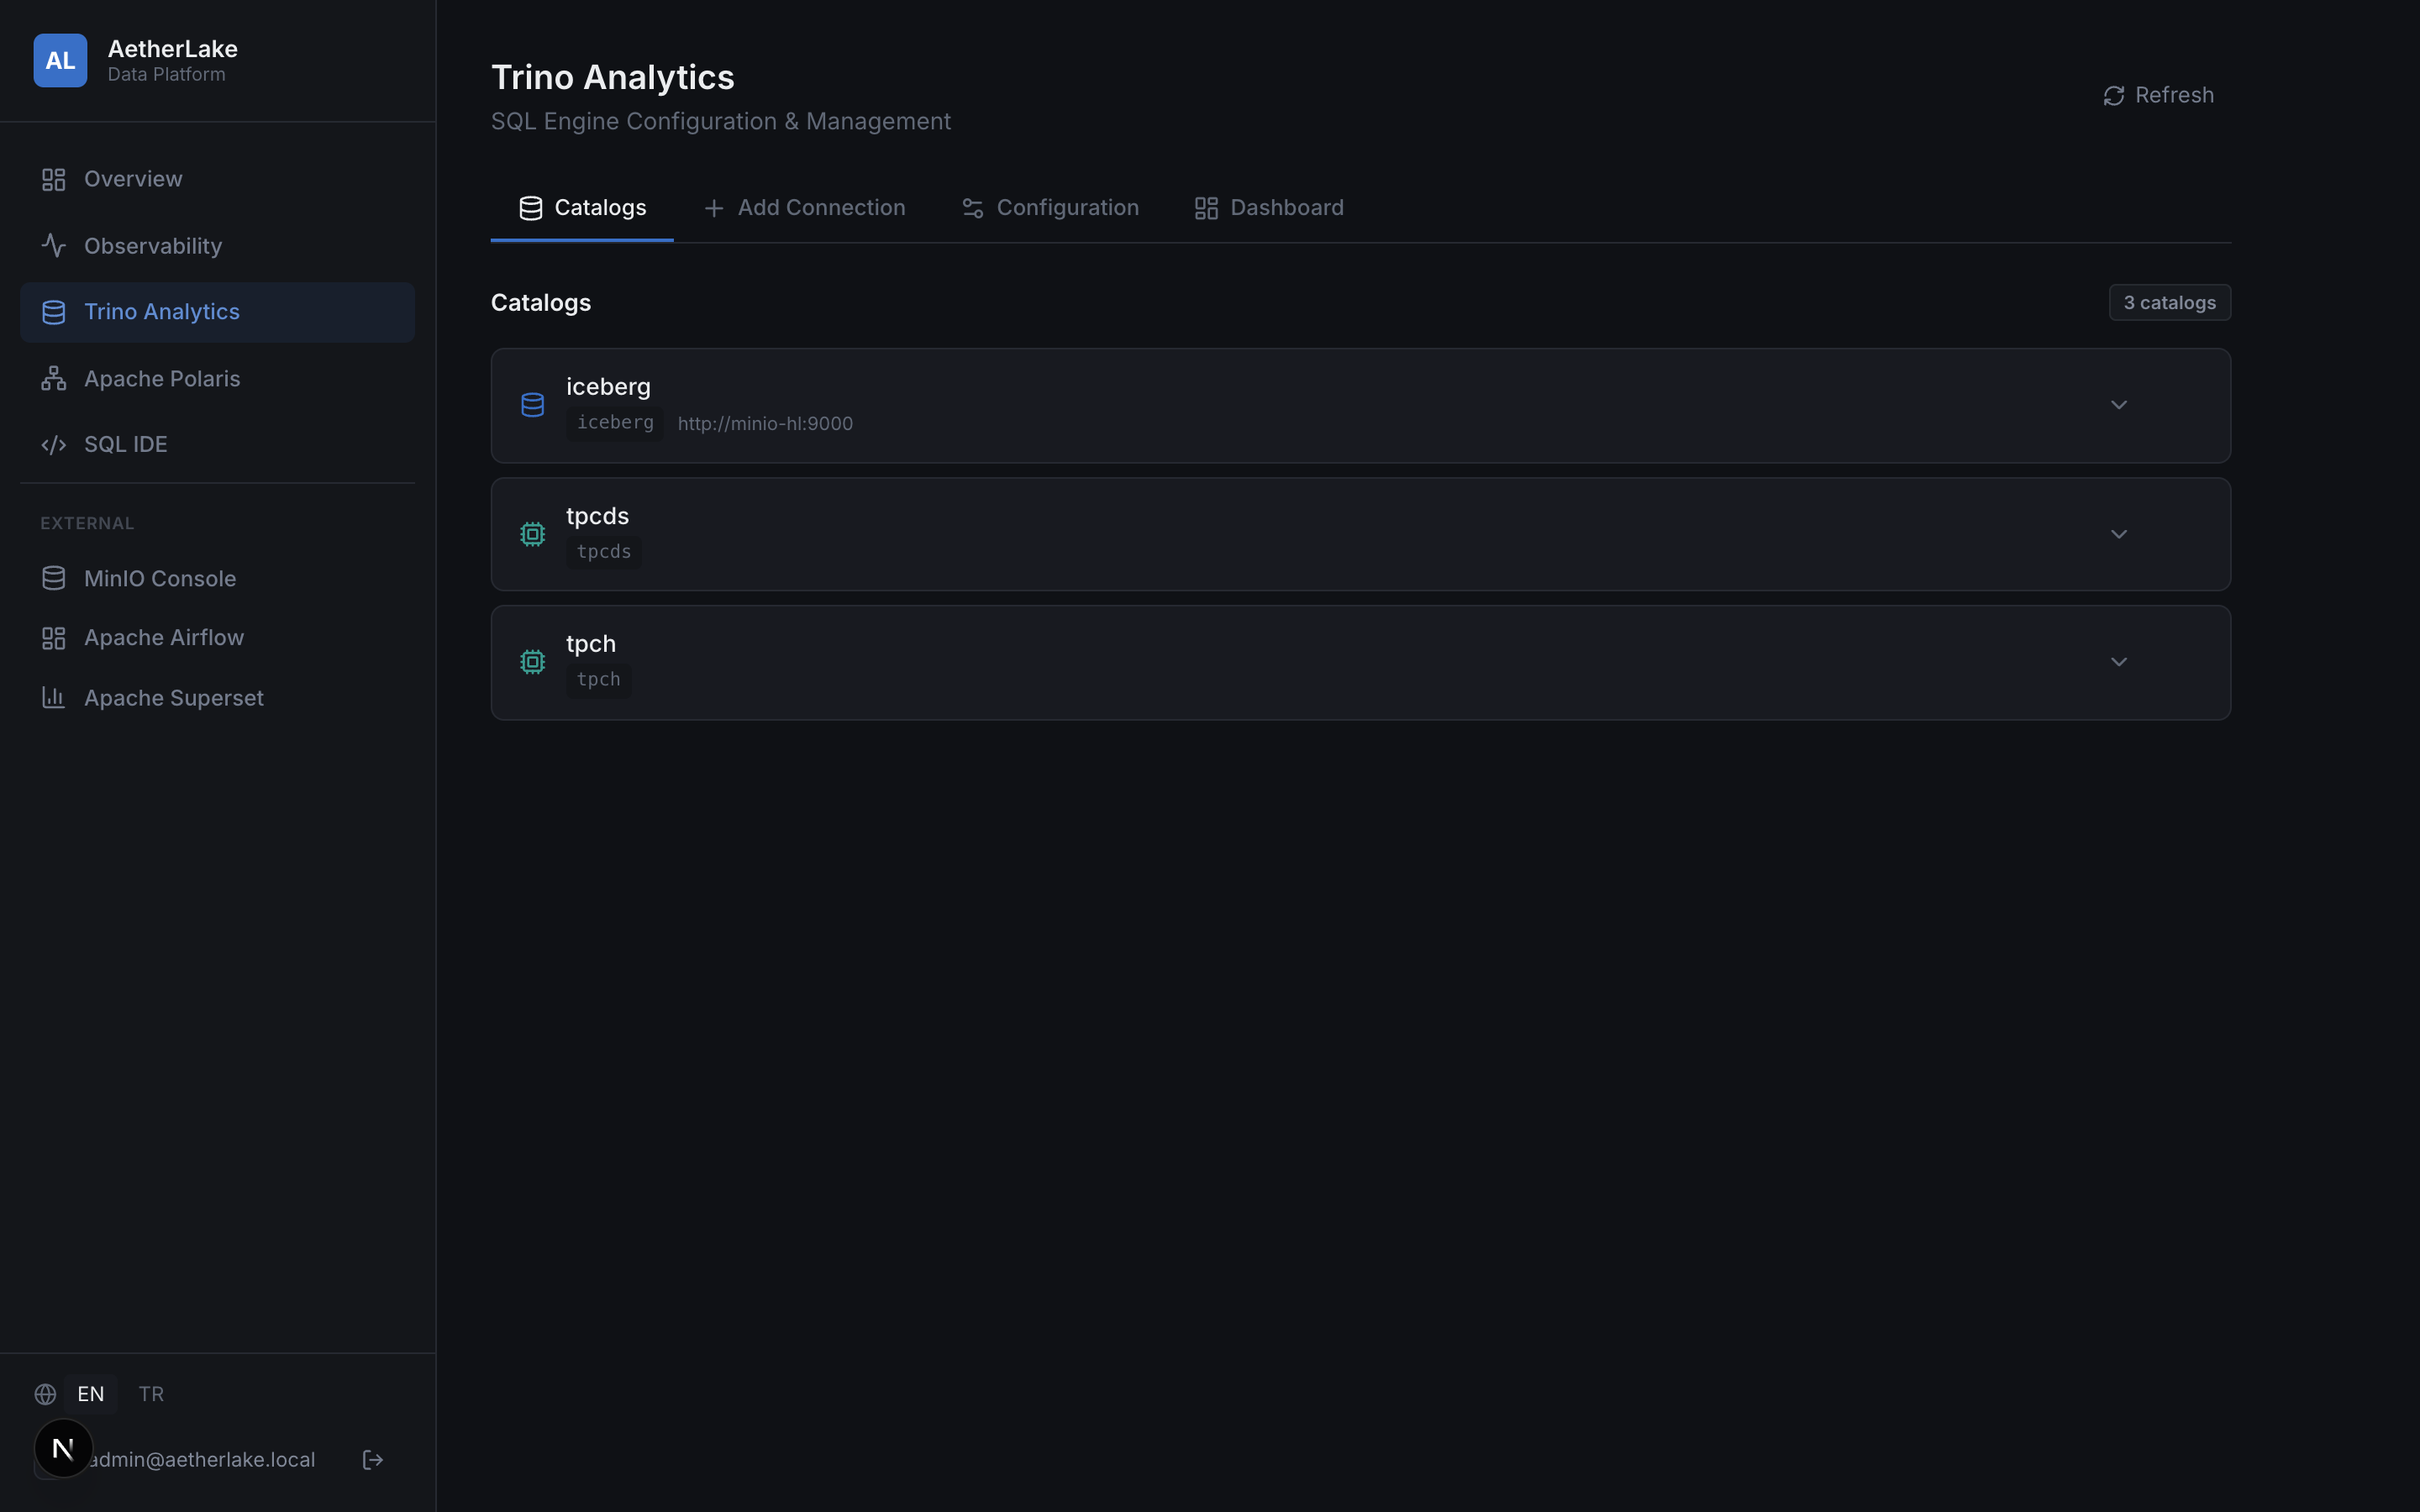
The Trino Management page monitors and configures the distributed SQL query engine:
- Engine KPI Grid: Configured Catalogs count, Active Worker Nodes, Coordinator Health Status (
HEALTHY), and Architecture (Distributed · Fault-Tolerant Execution). - Catalog Search Filter: Search through configured catalogs by name or connector type (
iceberg,hive,postgresql,mysql,tpch). - Query in SQL IDE: Every catalog row includes a direct shortcut button to open the SQL IDE configured to that catalog.
- Catalog Config Expander: View raw catalog properties with sensitive secrets automatically masked (
••••••••). - Add Catalog Wizard: Interactive modal supporting Iceberg REST, Hive Metastore, PostgreSQL, and MySQL connector templates.
- Trino Web Dashboard: Embedded native Trino UI for viewing live worker threads, stage execution trees, and distributed query plans.
🩺 Observability & Logs (/observability)
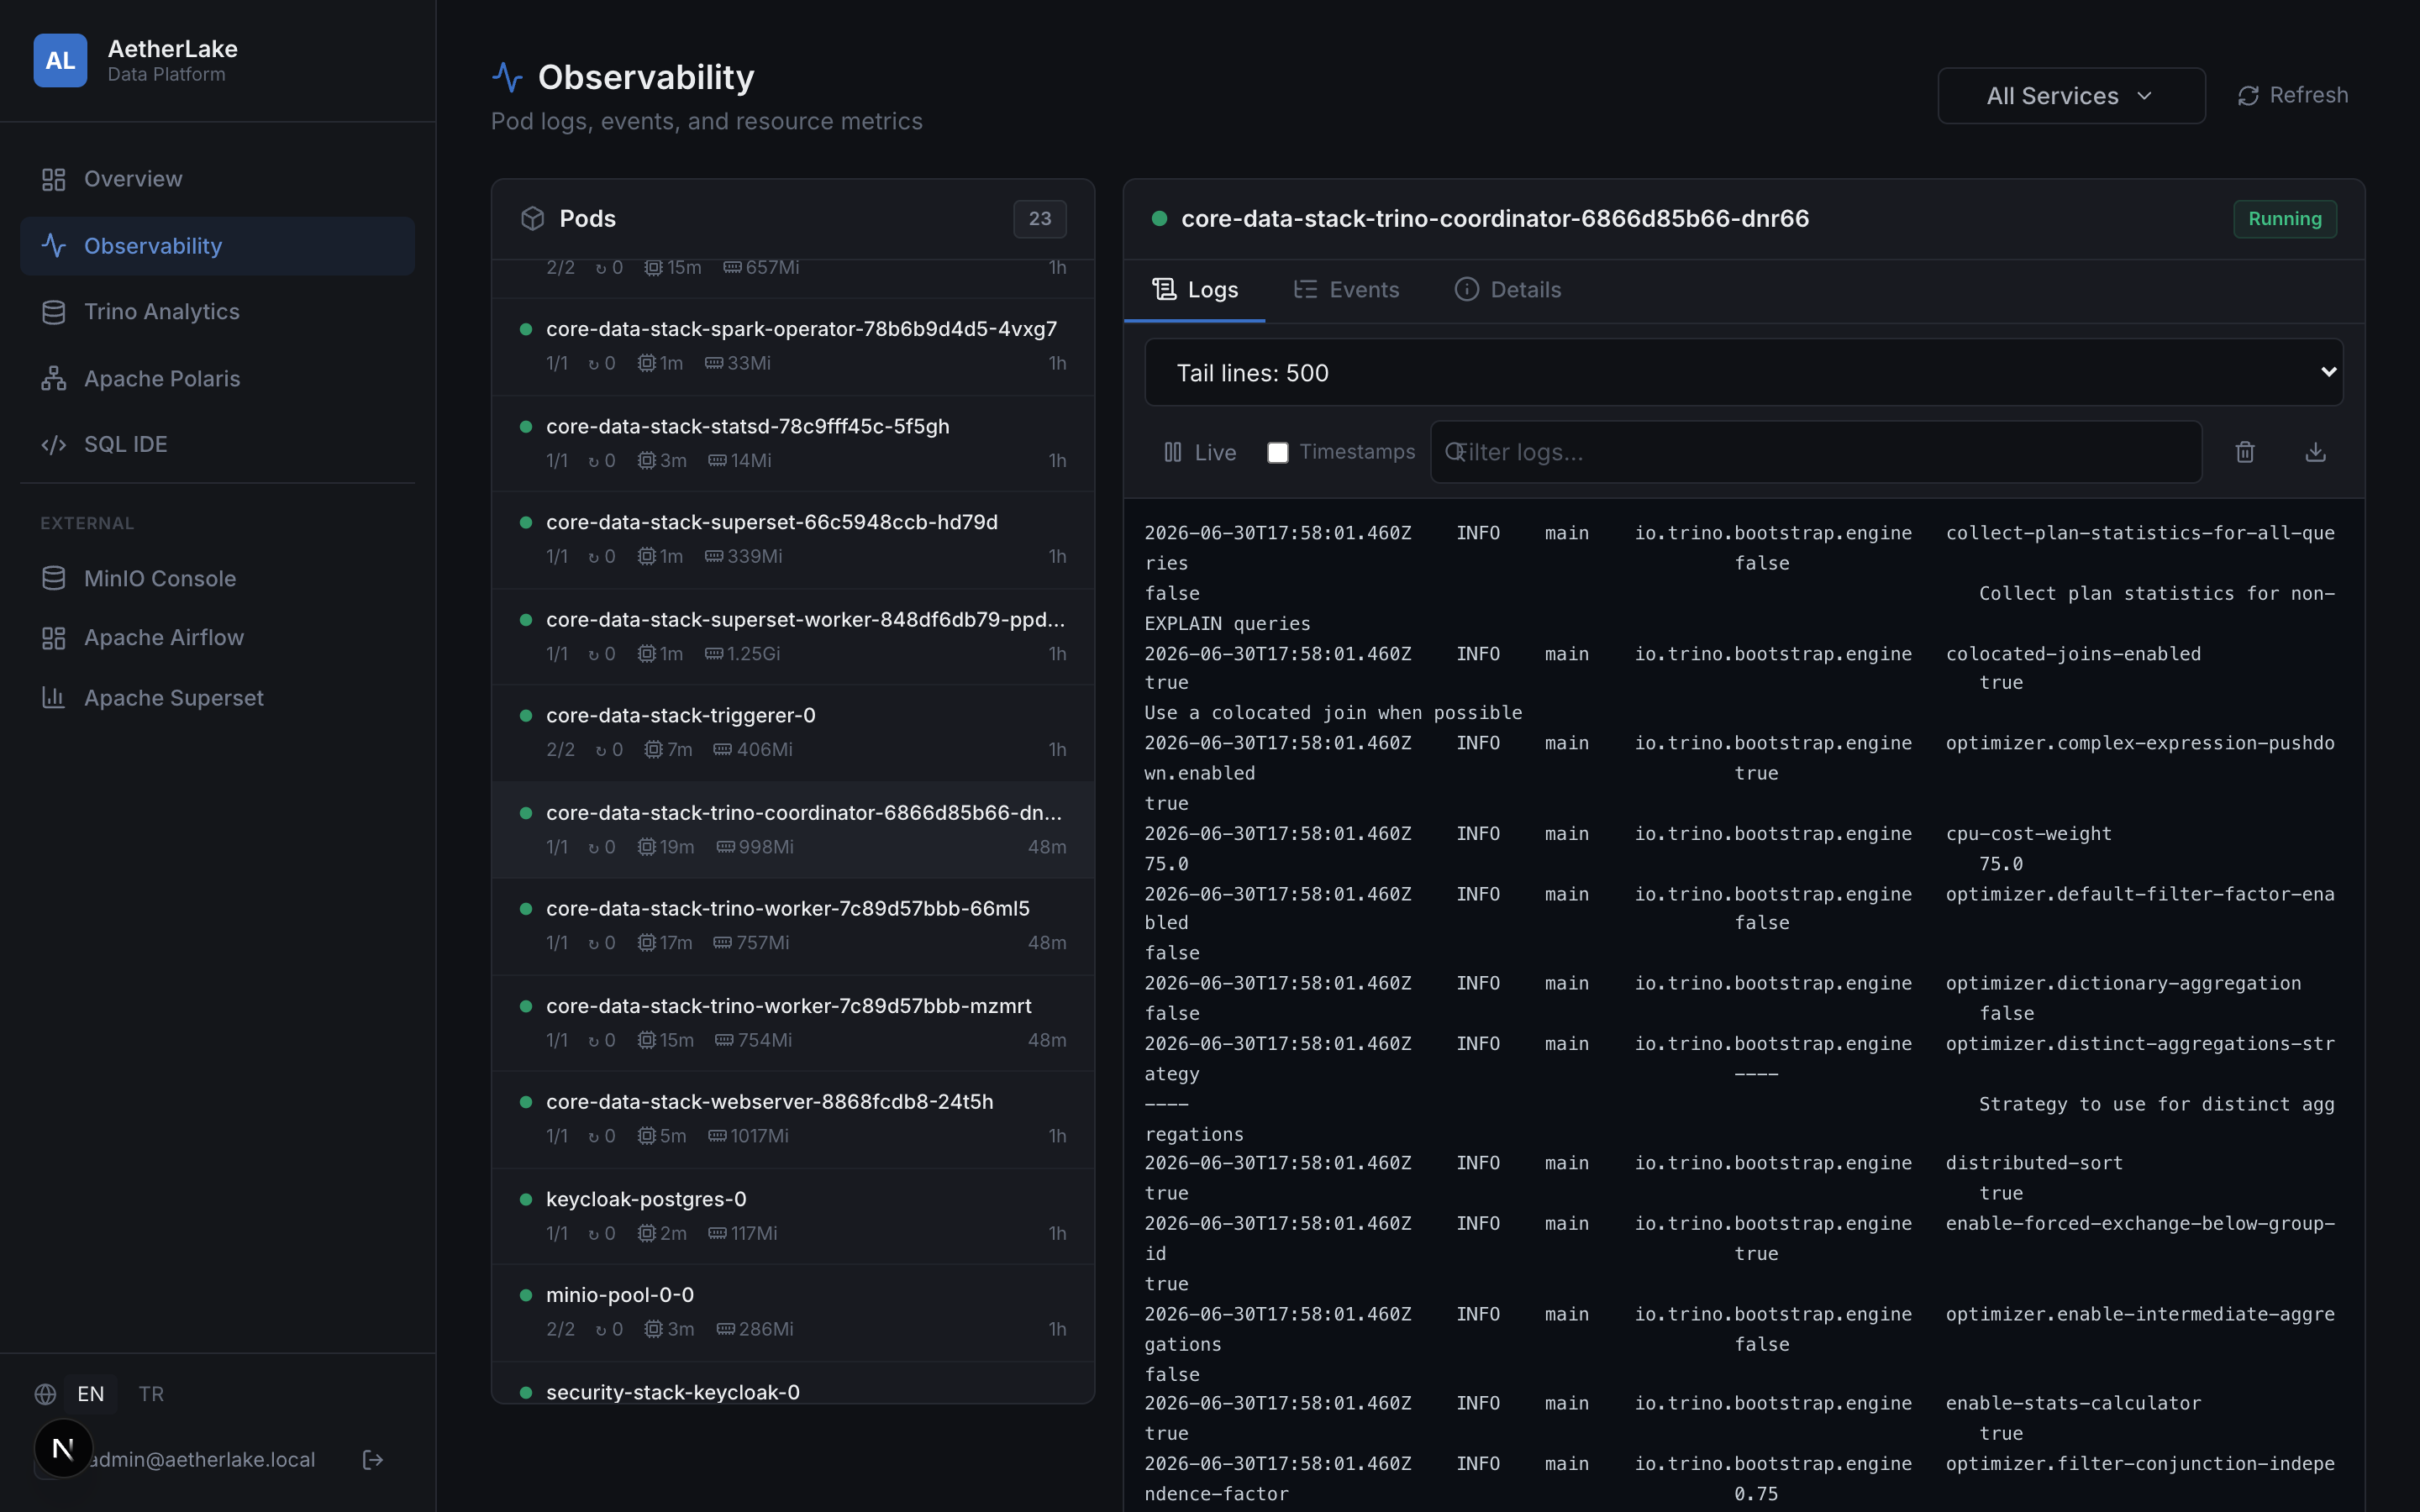
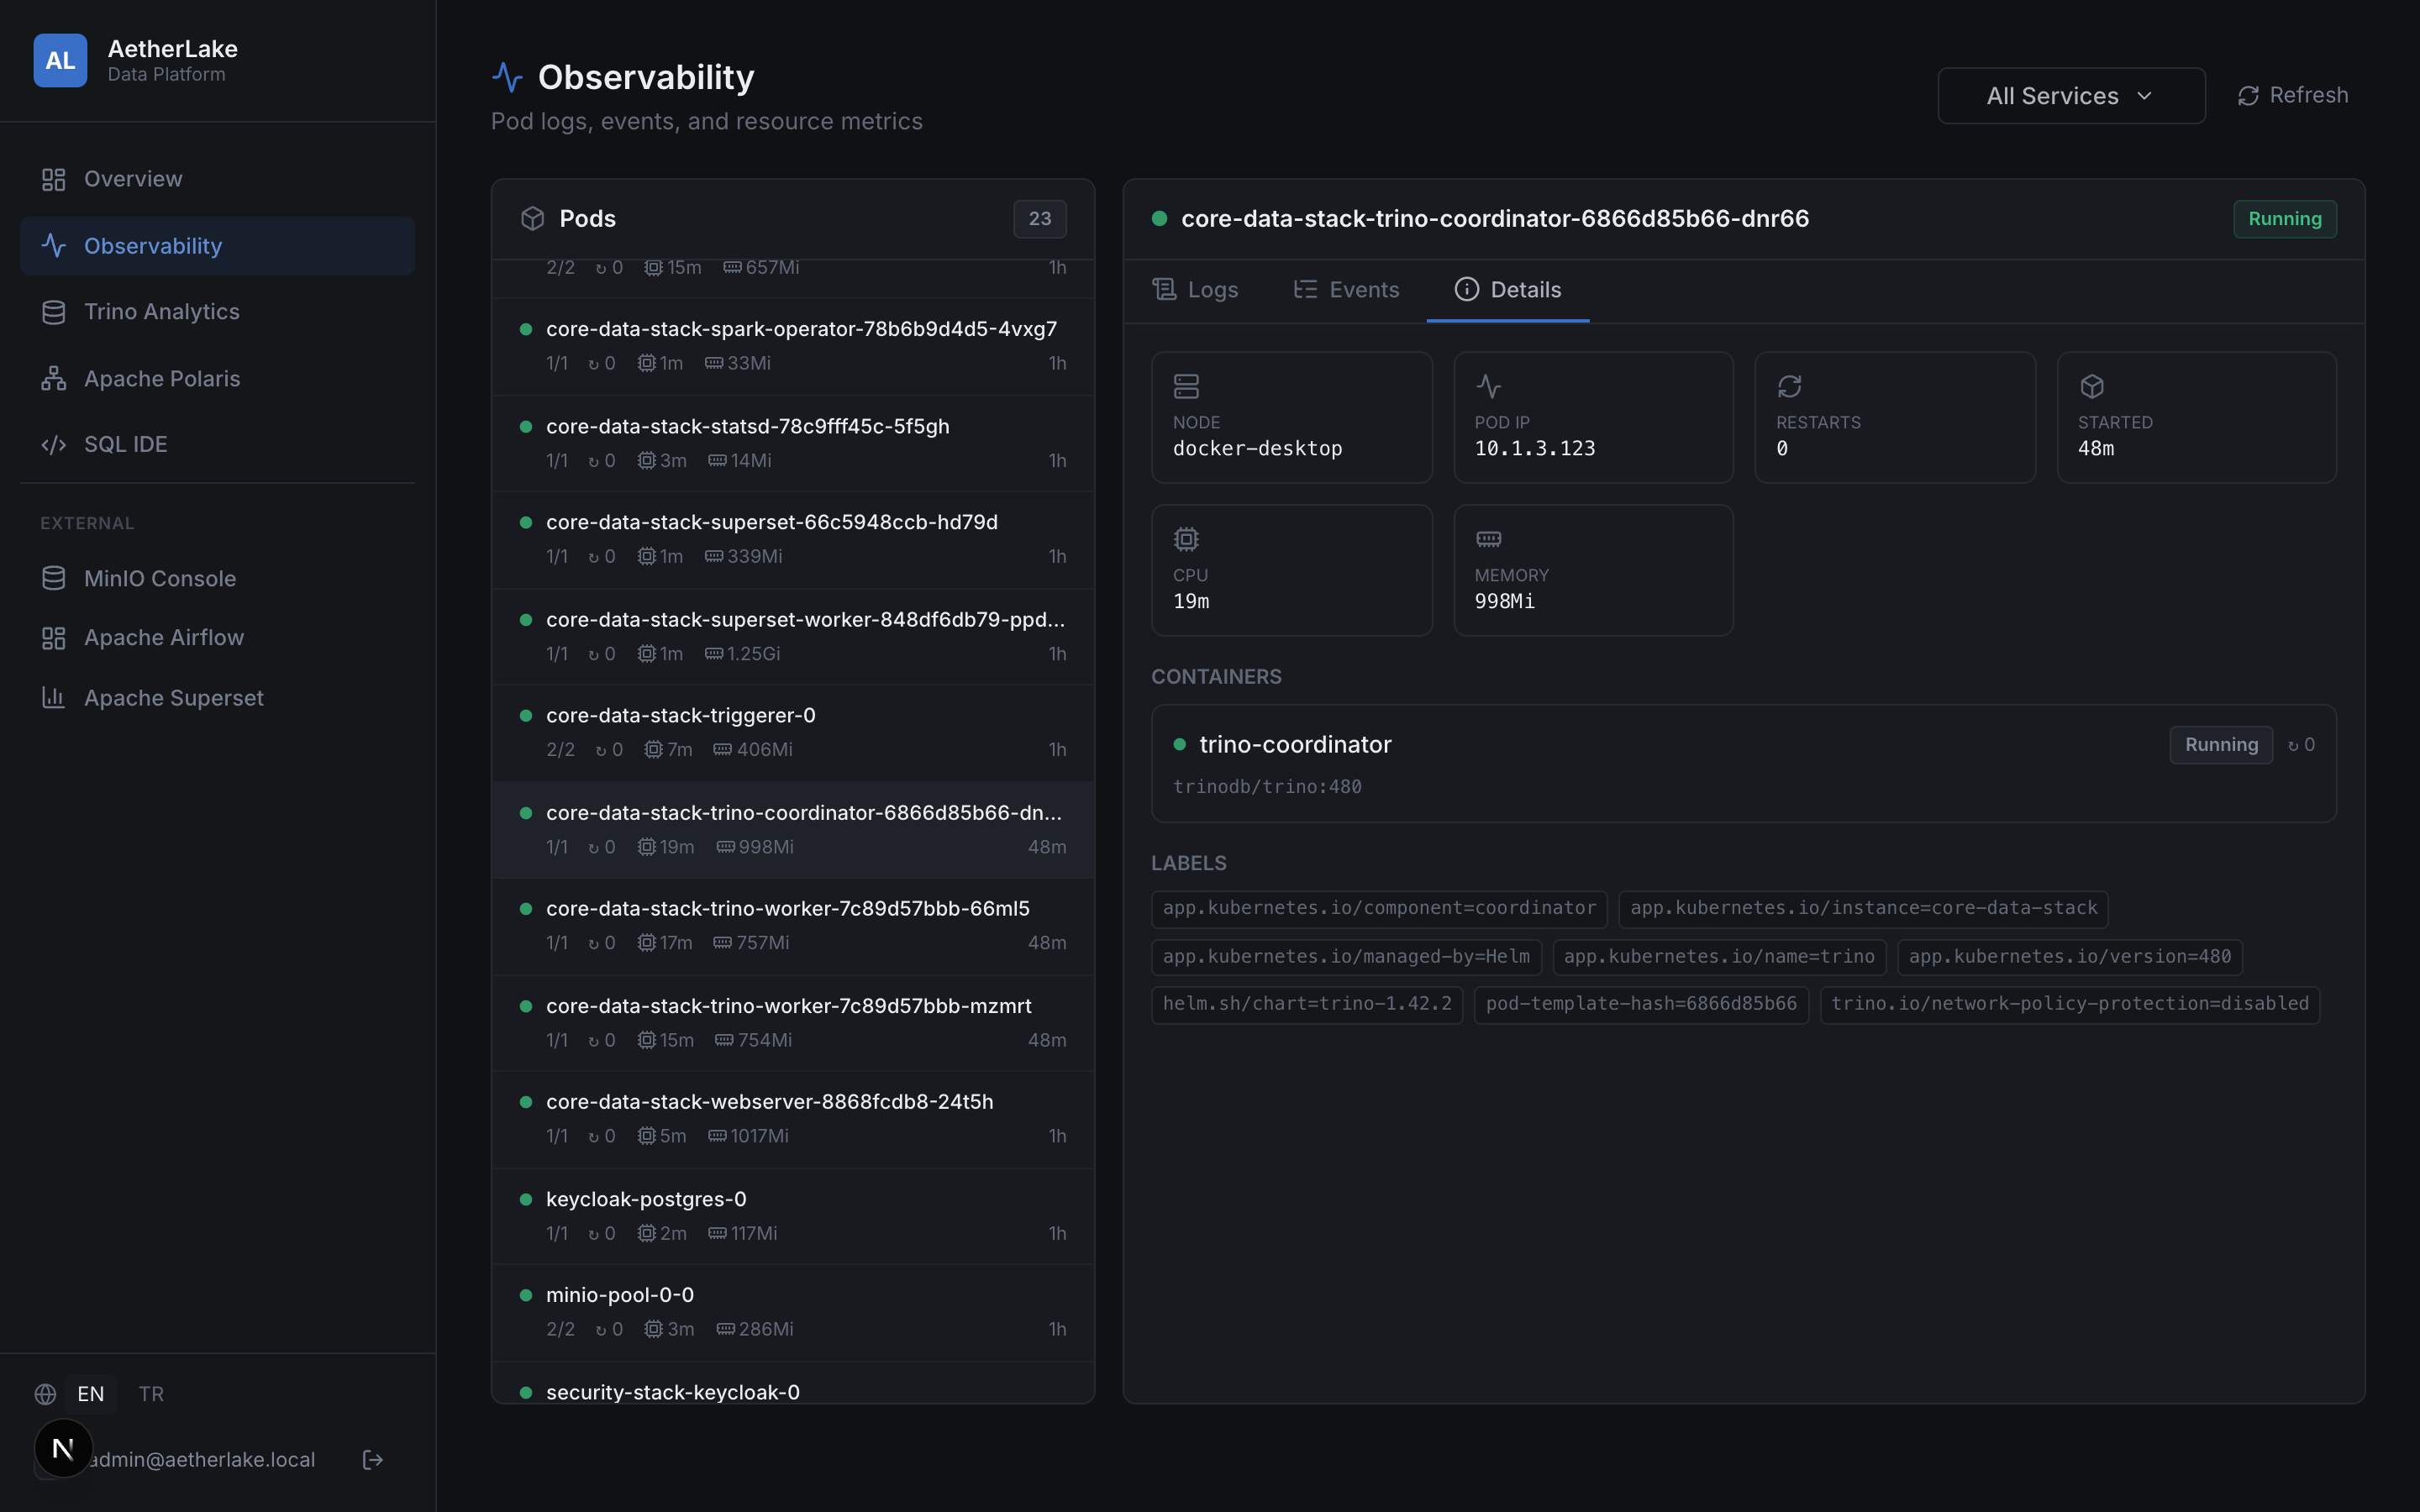
The Observability page provides comprehensive cluster diagnostics without leaving the Control Panel:
- Workload KPI Grid: Total Pods, Healthy Pods, Degraded/Pending Pods, and Total Pod Restarts across the namespace.
- Pod Search Filter: Instant search filter in the pod selection list to quickly isolate specific services or failed containers.
- Live Log Streamer:
- Live log streaming (
follow=true) using native browserReadableStreamchunk decoding. - Auto-scroll lock to stay at the tail of incoming log streams.
- Client-side log text search highlighting.
- Container switcher for multi-container pods.
- Tail lines control (
100,500,1000,5000). - Download: Export complete log files (
.log) with timestamps.
- Live log streaming (
- Kubernetes Events: Real-time Kubernetes events sorted chronologically with
Warningevents highlighted. - Pod Resource Metrics: Live CPU (millicores) and RAM (MiB/GiB) metrics from Kubernetes Metrics API.
🔄 dbt Lakehouse Workspace & Lineage (/dbt)
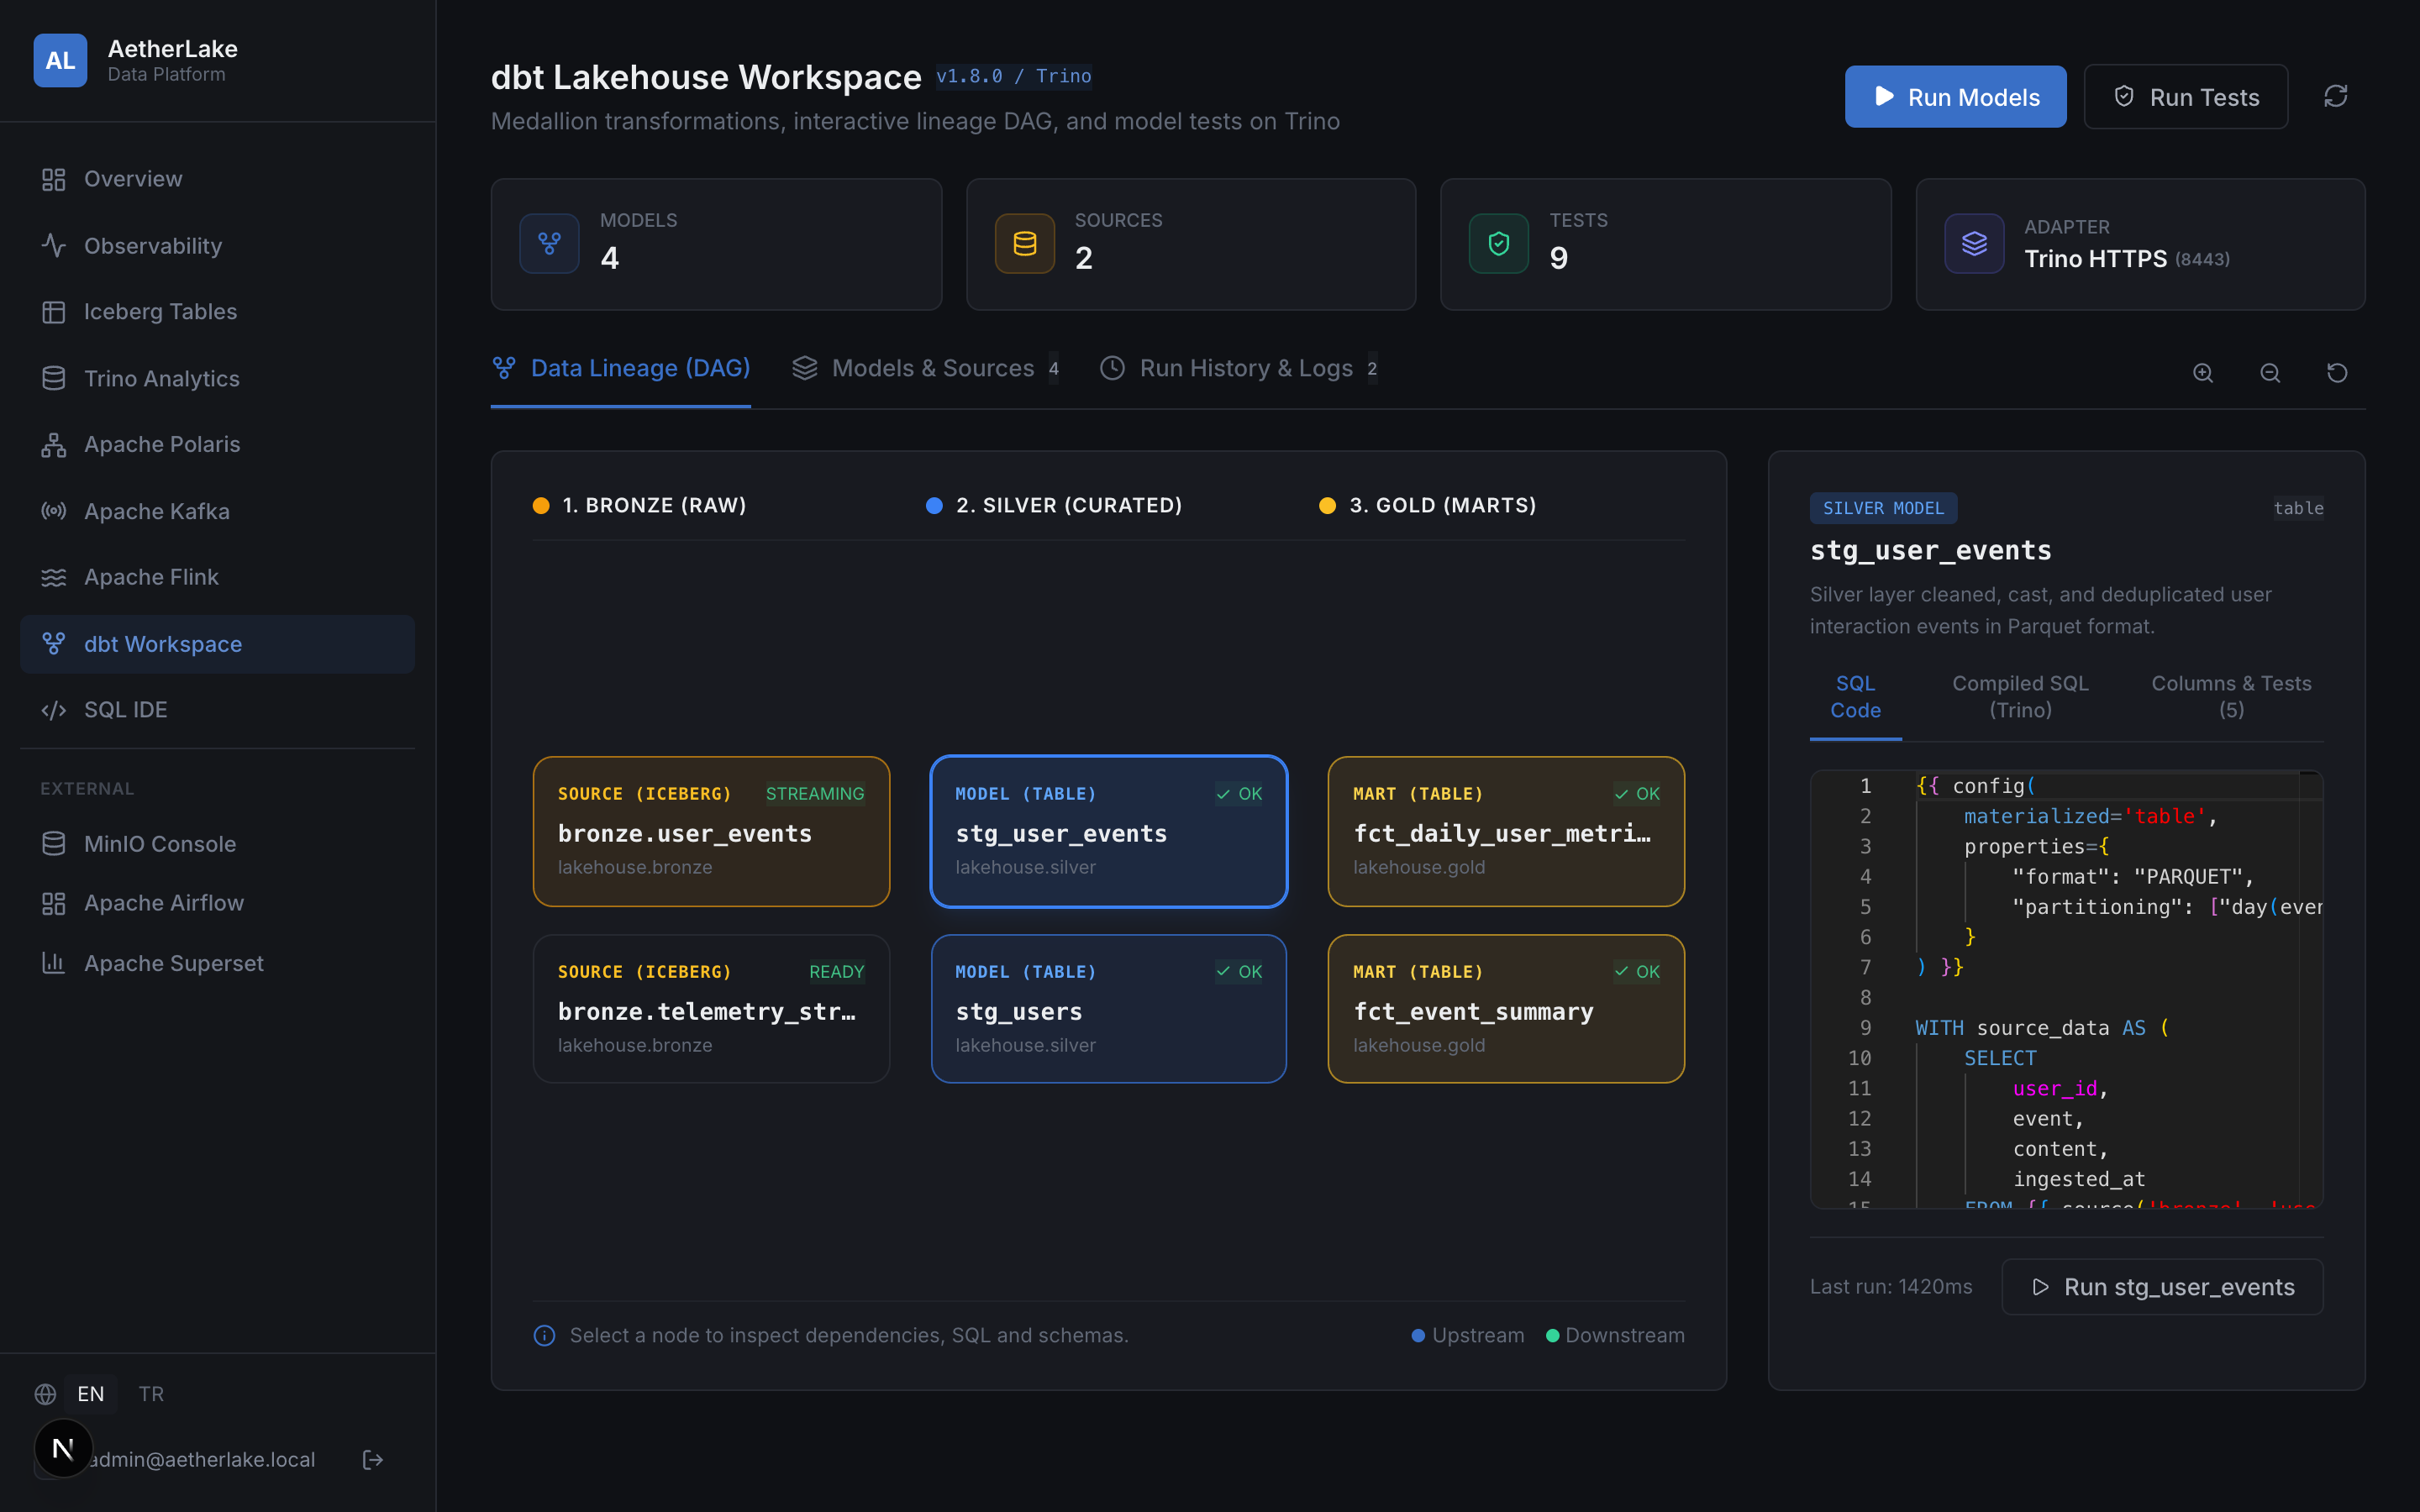
The dbt workspace (/dbt) provides visual management for Lakehouse data transformations:
- Interactive Lineage DAG: Scalable React Flow canvas spanning Bronze sources, Silver curated tables, and Gold analytics marts with directional Bezier curves, arrowheads, animated flow pulses, Dagre auto-layout, interactive radar minimap, and fullscreen mode.
- Model Inspector: Embedded Monaco editor inspecting raw Jinja SQL, compiled Trino SQL, partitioning specs, and model documentation.
- Dependencies Explorer: Clickable upstream parent and downstream child navigation.
- Data Quality Assertions: Review column-level schema definitions and dbt test validations (
unique,not_null,accepted_values). - Run & Test Triggers: Trigger
dbt runanddbt testagainst the Trino cluster and monitor live execution duration and logs.
💻 Running Locally
To run the Control Panel locally in development mode outside of Kubernetes:
cd control-panel
npm install
npm run dev
# Starts on http://localhost:3000
To run linting and compile production builds:
cd control-panel
npm run lint
npm run build